Suzanne Evans
Well-Known Member
FRM Fun 8 (Be better than 72% of surveyed professional economists)
Yesterday the world's greatest finance blogger posted "How economists get tripped up by statistics" at http://blogs.reuters.com/felix-salmon/2012/07/10/how-economists-get-tripped-up-by-statistics/. Can you do better than 72% of a sample of professional economists? (Note: the basic answer employs ideas that are FULLY within the scope of FRM Part 1).
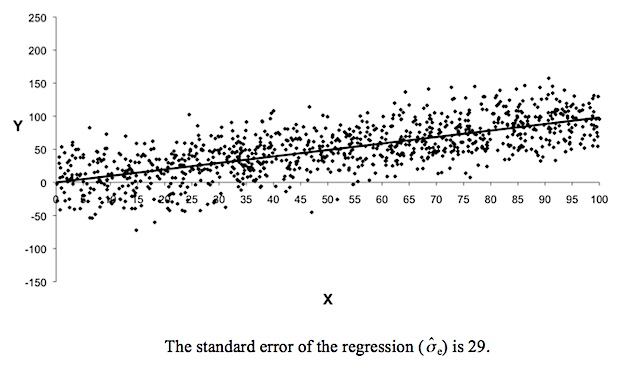
To boil it down, the economists were shown a scatterplot and its implied univariate regression: Y = C + B*X + e:

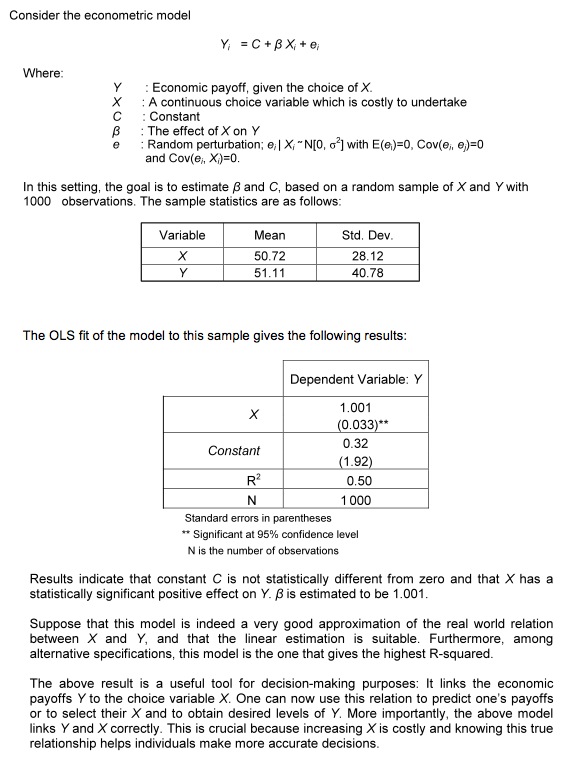
And some were also shown the regression data:

Here is the question put to economists:
Your challenge: show how the correct answer is derived?
(Bonus advanced query: do you think, like I do, that "standard error of the regression" in the chart is *maybe* an imprecise term .... )
Yesterday the world's greatest finance blogger posted "How economists get tripped up by statistics" at http://blogs.reuters.com/felix-salmon/2012/07/10/how-economists-get-tripped-up-by-statistics/. Can you do better than 72% of a sample of professional economists? (Note: the basic answer employs ideas that are FULLY within the scope of FRM Part 1).
To boil it down, the economists were shown a scatterplot and its implied univariate regression: Y = C + B*X + e:

And some were also shown the regression data:

Here is the question put to economists:
"Another dot is going to be added to this chart, in line with the distribution you see here. You get to choose what the X value of the dot is — and your aim is to get a Y value of greater than zero. So here’s the question: at what value of X are you going to have a 95% chance of getting a dot above the axis, in positive territory on the Y axis?"
Your challenge: show how the correct answer is derived?
(Bonus advanced query: do you think, like I do, that "standard error of the regression" in the chart is *maybe* an imprecise term .... )
