FRM Fun 8 (Wed)

Suzanne Evans

Well-Known Member
FRM Fun 8 (Be better than 72% of surveyed professional economists)

Yesterday the world's greatest finance blogger posted "How economists get tripped up by statistics" at http://blogs.reuters.com/felix-salmon/2012/07/10/how-economists-get-tripped-up-by-statistics/. Can you do better than 72% of a sample of professional economists? (Note: the basic answer employs ideas that are FULLY within the scope of FRM Part 1).

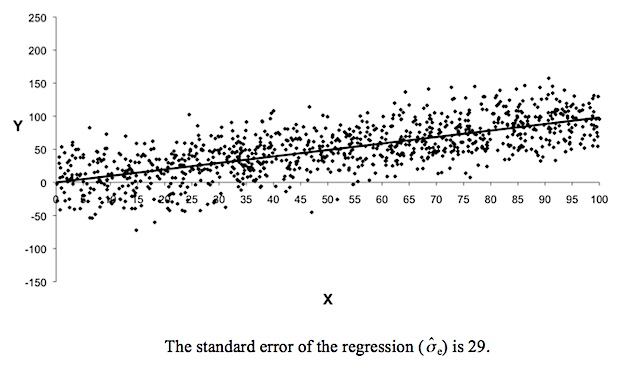
To boil it down, the economists were shown a scatterplot and its implied univariate regression: Y = C + B*X + e:
0710_frmfun8_a.jpg


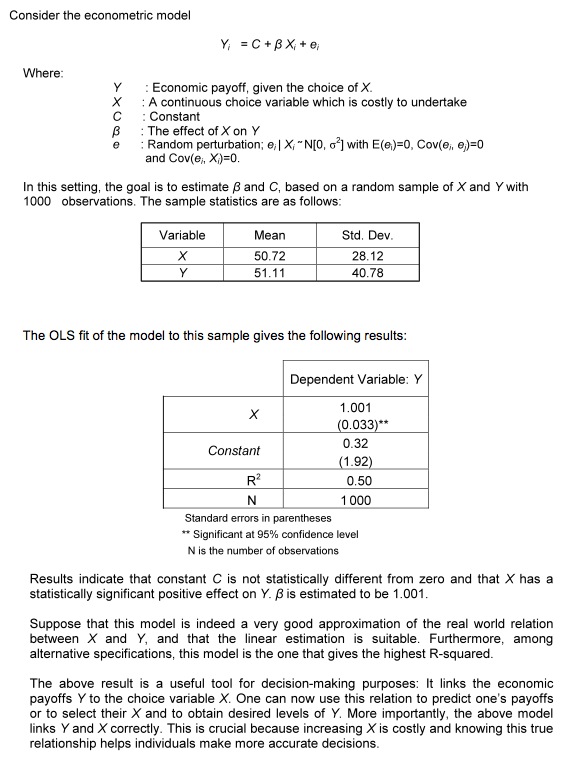
And some were also shown the regression data:
0710_frmfun8_b.jpg

Here is the question put to economists:
"Another dot is going to be added to this chart, in line with the distribution you see here. You get to choose what the X value of the dot is — and your aim is to get a Y value of greater than zero. So here’s the question: at what value of X are you going to have a 95% chance of getting a dot above the axis, in positive territory on the Y axis?"

Your challenge: show how the correct answer is derived?
(Bonus advanced query: do you think, like I do, that "standard error of the regression" in the chart is *maybe* an imprecise term .... )
 
I'll approach the question in following way...
Given Liner regression model Yi = C+B*Xi +ei
then estimated Ŷi = Cˆ+Bˆ*Xi +eiˆ
Where Cˆ, Bˆ and eiˆ are estimates of C, B and ei respectively
Under the normality assumption Cˆ, Bˆ and eiˆare normally and independently distributed. As a result Ŷi is also normally distributed as ~ N(C+B*Xi, σ2)

Z-test for E(Yi | Xi ) > 0 with 95% confidence
Z = [Ŷi - Yi]/ Se(Ŷi)

Z = [(Cˆ+Bˆ*Xi)-Yi]/Se(Ŷi) = 1.645

(Cˆ+Bˆ*Xi)-1.645*Se(Ŷi) = Yi
for Yi>0 we have X> [1.645*Se(Ŷi) – Cˆ]/Bˆ

given Cˆ = 0.32, Bˆ = 1.001
where Se(Ŷi) = sqrt(var(Ŷi))
sqrt(var(Ŷi)) = sqrt[∑( Ŷi – Ÿ)2]
∑( Ŷi – Ÿ)2 is nothisg but Explain Sum of squares, ESS
then, sqrt[ESS] = sqrt[r2 * var(Yi) ] = sqrt(0.5)* 40.78 = 29 approx.

putting this value in above eq, we get X> 47 approb i.e Xmin = 47

on the bonus, here what the question states as 'std. error of regression' i.e. Se(eiˆ) is in fact std error of Ŷi.....
 
I arrived at the answer as:
Regression Equation is:
Y=1.001X+.32
Z=(Y-0)/SE(Y)
At 95% CL z=1.645
At 95% CL for value of Y to be >0: z>1.645
or that (Y-0)/SE(Y)> 1.645
or that (1.001X+.32-0)/(29)> 1.645
[SE(Y)=summation of (Y-Yactual)^2= summation of e^2 implies SE(Y)=SE(e)=29]
or that 1.001X+.32>47.705
or that 1.001X>47.705-.32
or that X>(47.705 -.32)/1.001
or that X>47.3376
which implies min value of 48. So at value of X=48 there is 95% CL that predicted value of Y will be more than 0.

Regarding the second part: from regression equation
Y=Beta*X+ e
Or SD(Y)^2=SD(Beta*X+ e)
Or SD(Y)^2=SD(Beta*X)^2+ SD( e)^2
Or SD(Y)^2=SD(Beta*X)^2+SD( e)^2
Given Beta=1.001; SD(X)=28.12;SD(Y)=40.78
Or 40.78^2= ( 1.001 * 28.12 )^2+ SD( e)^2
Or 1663=792.31+SD( e)^2
Or 1663- 792.31=SD( e)^2=870
SD( e)= 29.495 which is approx.. equal to 29. Hence the standard error of regression is slightly an imprecise term varying from actual value of 29.495 .
 
@aadityafrm and @ShaktiRathore: thank you, I gave each of you the "Win."

I agree with you that, it appears the solution is based on: predicted Y( lower bound) = 0.32 + 1.001X - SER*critical t(95%, 999 df), where critical t ~ 1.645 (i.e., one tailed!) such that X = (29*1.645 - 0.32)/1.001 ~= 47.4

I'm encouraged that you seem to agree with me that SER is maybe misplaced. As the question contemplates the confidence interval of a new (currently unobserved) datapoint, I too was thinking this really wants the SE of predicted Y (aka, SE of forecast) ... which is then utilized to craft what is i think called the prediction interval ... which, implied by ShaktiRathore I think, is not a set of parallel bound but rather varies in width based on distance from the mean. Put another way, the relevant standard error (IMO) would not be a constant 29 but a function of X. But it's a softly held view, I have not delved into the paper ...

Thank you so much!
 
Top