Short Equity T + long Mezzannine T (correlation impact?)

rajeshtr

Member
Hi David, I am struggling to understand this concept of loss occurring (i.e Spread change in Equity Tranche and Mezzanine Tranche).

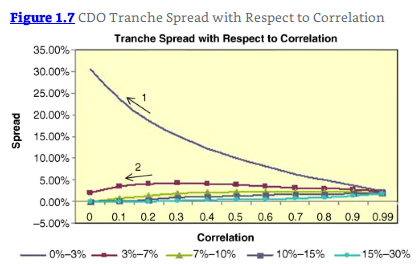
1) Why does Equity Tranche spread increases if the correlation decreases as shown in the graph below. (eg. If correlation is high in the equity tranche - the full tranche will get wiped out and hence the spread should be high --> This is why i am getting confused with the material and graph arrow 1). Even if Ford and GM were rated as Junk bonds, how did it impact the CDO tranche to reduce the correlation..

2) " Spread decreases when the correlation decreases". But atleast that is in line with the concept that the entire tranche will not get wiped out and hence asking for lower spread as the correlation decreases.
But the fundamental question is why GM, Ford categorization of Junk bonds decreased the correlation.

upload_2017-2-16_8-35-6.png
 

David Harper CFA FRM

David Harper CFA FRM
Subscriber
Hi @rajeshtr

Re: Why does Equity Tranche spread increases if the correlation decreases as shown in the graph below.
This is classically illustrated with the binomial. For example, assume a pool of 10 bonds each with PD = 1.0%. Let the equity tranche correspond to the first-to-default (1TD) trigger. If the bonds are perfectly correlated, they act as single bond, and the probability of equity defaulting is 1.0%. Now lower the correlation to zero, and what is the probability of a 1TD trigger? It is 100% - (100% - 1%)^10 = 9.562%; i.e., an increase in the probability. Please note (because this can actually be the confusing aspect!) that the increase in probability (associated with lower correlation) implies decrease in the value of the "equity tranche" (higher risk) which corresponds to an increase in the spread. There is more here, among several other places in the forum https://forum.bionicturtle.com/threads/basket-tranches-value-and-risk.5901/#post-26713

you can hopefully see how the senior tranche behaves very differently. To be extreme, assume the senior tranche is linked to the last to default bond; in other words, to be wiped out, all of the bonds would need to default. Under perfect correlation (10 bonds, PD = 1%), this is fully a 1% probability. Under zero correlation, the likelihood is infinitesimal (basically zero) = 1%^10. For the seniormost bond, a decrease in correlation --> higher value --> lower spread.

In regard to this graph in particular, can I please refer you to my post from only last month where I discussed this in more detail https://forum.bionicturtle.com/thre...on-related-crisis-chapter-1.10111/#post-47639 (it contains even another link to even earlier conversation). For convenience, I have embedded it below. I think this goes pretty deep on the challenges of interpreting the graph, but of course feel free to follow-up.

Hi @RobKing I imagine you mean to refer to Meissner's Chapter 1. Please note there some debate-disagreement last year about certain of his assertions, or at least his semantics (eg, https://forum.bionicturtle.com/threads/error-in-meissner-text.9137/#post-40675)

In my previous post (full text is copied below; link here @ https://forum.bionicturtle.com/thre...anagement-meissner-chapter-1.8207/#post-43073) I tried to explain Meissner's GM/Ford correlation-related crisis. For me, the key is to focus on his two arrows (#1 and #2 in this graph).
0620-tranche-correlations.png


But I think it firstly helps to keep in mind some fundamentals:
  • The CDO itself issues tranches of liabilities to investors. Here we expect the following classic dynamic with respect to a decrease in default correlation (please note that is a movement from right to left in Meissner's Fig 1.7 above)
    • Equity tranche spread increases (lower ρ --> lower value/higher spread as confirmed by Arrow #1 above)
    • Senior tranche spread decreases (lower ρ --> higher value/lower spread as confirmed by non-arrowed tranche 15%-30% above, say)
    • I agree with Brian's point elsewhere that Mezzanine dynamic depends, so we can't say anything general and necessary about the mezz
  • Separately, the hedge fund investors took positions that referenced the CDO tranches. The look similar to positions in credit indices (eg, Markit's iTraxx or CDX); e.g., 0 to 3%, 3 to 7%. Meissner writes (emphasis mine) "This led to huge losses of hedge funds [sic], which had put on a strategy where they were short the equity tranche of the CDO and long the mezzanine tranche of the CDO. Figure 1.7 shows the dilemma. Hedge funds had shorted the equity tranche [endnote 10] (0% to 3% in Figure 1.7) to collect the high equity tranche spread. They had then presumably hedged [endnote 11] the risk by going long the mezzanine tranche [endnote 12] (3% to 7% in Figure 1.7)."
I think endnotes 10 and 12 tell the story:
  • Endnote 10: "Shorting the equity tranche means being short credit protection or selling credit protection, which means receiving the (high) equity tranche contract spread."
  • Endnote 12: "Going long the mezzanine tranche means being long credit protection or buying credit protection, which means paying the (fairly low) mezzanine tranche contract spread."
  • So it looks like the hedge funds under consideration wrote CDS (sold credit protection) on the CDO equity tranche and, in an attempt to hedge, bought CDS (bought credit protection) on the CDO mezz tranche expecting them to react similarly to correlation shifts. If the mezzanine position was a hedge, they must have expected the mezzanine trance to react to lower correlation in a way similar to the equity: they expected lower default correlation to associate with higher spreads (lower value). But it acted more like a senior tranche.
  • With respect to the equity position, per Arrow #1 below, lower default correlation implies higher spread (lower value) for the CDO tranche. But (here's where I was originally confused :eek:) the hedge fund did not own/short the CDO equity tranche, it has sold credit protection on the tranche (aka, short CDS that referenced the tranche) so its "short" position is a short CDS which is synthetically long the underlying bonds. They lost on this written protection when the underlying bonds downgrade, in the same way they would experience a M2M loss on a short CDS that referenced the bonds directly (without the intermediation of a CDO, so to speak)
  • With respect to the mezz, the hedge wasn't long (owning) the CDO tranche but rather it was long CDS that referenced the tranche (aka, buying protection on the tranche) such that lower default correlation did unexpectedly increase the value of the tranche (ie, lower spread per Arrow #2 below) but gives a loss to the long CDS that it references. I hope that is clarifying!
From https://forum.bionicturtle.com/thre...anagement-meissner-chapter-1.8207/#post-43073
I think @brian.field and @QuantMan2318 have explained this difficult idea brilliantly. I definitely agree that, as an exam matter, superficially the correct answer with respect to the Mezzanine (when we have no other information) is exactly what Brian says: "The effect in the Mezzanine Tranche is unclear."

@arkabose In regard to your specific observation, I think you are referring to Meissner's statement which references his Figure 1.7 (below): "In addition, the hedge funds lost on their long mezzanine tranche positions, since a lower correlation lowers the mezzanine tranche spread; see arrow 2. Hence the spread that the hedge funds paid in the original transactions was now higher than the market spread, resulting in another paper loss. "
0620-tranche-correlations.png


  • Re equity tranche: You can see most visibly here the typical dynamic of the equity tranche (Arrow #1; 0-3%): as correlation increases (ie, left to right on the x-axis), the spread is decreasing, so the value of the tranche is increasing (same point as question 502.3 above). Same as Brian's point about equity and, I assume, the QuantMan's positive convexity
  • Re senior tranche: You can generally see this in the 15-30% tranche: as correlation increases, spread increases and value decreases.
  • Re: Mezzanine: This is illustrated by Meissner's Arrow #2 (3 to 7% tranche) and you will notice that, typically, its plot is initially (at lower correlations) concave down (the slope is continually decreasing; as QuanMan says, negative convexity) but then shifts to approximately positively convex. So, even when referring to this tranche itself under these assumptions, we cannot say the Mezzanine tranche value is only increasing or decreasing. Rather, starting from zero correlation, as correlation increases, the Mezzanine value initially is acting more like a senior bond with increasing spread (decreasing value) but then shifts over the acting more like the equity tranche with decreasing spread (increasing value). I hope that helps! From https://forum.bionicturtle.com/thre...anagement-meissner-chapter-1.8207/#post-43073
 
Last edited:

rajeshtr

Member
Hi David, Wow : such a complex topic involving Correlation, (PD, Spread) and Equity Value.

After reading all the details in that forum : I am now fine with
1. Equity Tranche : falling in value (Increasing spread, Increasing P.D.) with decreasing correlation.
2. Senior Tranche : Increasing in value (Decreasing Spread, Decreasing P.D.) with decreasing correlation.
3. Mezzanine Tranche : falling in value with decreasing correlation @ lower correlation levels
and : increasing value with decreasing correlation @ higher correlation levels

But i still confused why Correlation Decreased? (why GM, Ford categorization of Junk bonds decreased the correlation.) Should this be assumed as a Market phenomenon that happened or am i missing something? (eg., Correlation increases in crisis times and this was going to be the crisis start 2007-2009).
 

David Harper CFA FRM

David Harper CFA FRM
Subscriber
Hi @rajeshtr Agreed, a complex topic. You ask why correlation decreased in May 2005, which apparently is the "first correlation-related crisis" and a "front-running of the major one to come in 2007 to 2009." That's a great question! I don't really know so I skimmed through some of the end of chapter references and the Economist article referenced gives somebody's front-row-seat answer. Article is here http://www.economist.com/node/11897037 but I copied it below.

Notice that Gary Neil writes "In May 2005 we held AAA tranches, expecting them to rise in value, and sold non-investment-grade tranches, expecting them to go down. From a risk-management point of view, this was perfect: have a long position in the low-risk asset, and a short one in the higher-risk one. But the reverse happened of what we had expected: AAA tranches went down in price and non-investment-grade tranches went up, resulting in losses as we marked the positions to market. This was entirely counter-intuitive. Explanations of why this had happened were confusing and focused on complicated cross-correlations between tranches. In essence it turned out that there had been a short squeeze in non-investment-grade tranches, driving their prices up, and a general selling of all more senior structured tranches, even the very best AAA ones." Very interesting! I hope that is helpful ...

The Economist (Aug 7th 2008) "A personal view of the crisis, Confessions of a risk manager"
(Why did banks become so overexposed in the run-up to the credit crunch? A risk manager at a large global bank—someone whose job it was to make sure that the firm did not take unnecessary risks—explains in his own words)
by Gary Neil
IN JANUARY 2007 the world looked almost riskless. At the beginning of that year I gathered my team for an off-site meeting to identify our top five risks for the coming 12 months. We were paid to think about the downsides but it was hard to see where the problems would come from. Four years of falling credit spreads, low interest rates, virtually no defaults in our loan portfolio and historically low volatility levels: it was the most benign risk environment we had seen in 20 years.

As risk managers we were responsible for approving credit requests and transactions submitted to us by the bankers and traders in the front-line. We also monitored and reported the level of risk across the bank's portfolio and set limits for overall credit and market-risk positions.

The possibility that liquidity could suddenly dry up was always a topic high on our list but we could only see more liquidity coming into the market—not going out of it. Institutional investors, hedge funds, private-equity firms and sovereign-wealth funds were all looking to invest in assets. This was why credit spreads were narrowing, especially in emerging markets, and debt-to-earnings ratios on private-equity financings were increasing. “Where is the liquidity crisis supposed to come from?” somebody asked in the meeting. No one could give a good answer.

Looking back on it now we should of course have paid more attention to the first signs of trouble. No crisis comes completely out of the blue; there are always clues and advance warnings if you can only interpret them correctly. It was the hiccup in the structured-credit market in May 2005 which gave the strongest indication of what was to come. In that month bonds of General Motors were marked down by the rating agencies from investment grade to non-investment grade, or “junk”. Because the American carmaker's bonds were widely held in structured-credit portfolios, the downgrades caused a big dislocation in the market.

Like most banks we owned a portfolio of different tranches of collateralised-debt obligations (CDOs), which are packages of asset-backed securities. Our business and risk strategy was to buy pools of assets, mainly bonds; warehouse them on our own balance-sheet and structure them into CDOs; and finally distribute them to end investors. We were most eager to sell the non-investment-grade tranches, and our risk approvals were conditional on reducing these to zero. We would allow positions of the top-rated AAA and super-senior (even better than AAA) tranches to be held on our own balance-sheet as the default risk was deemed to be well protected by all the lower tranches, which would have to absorb any prior losses.

In May 2005 we held AAA tranches, expecting them to rise in value, and sold non-investment-grade tranches, expecting them to go down. From a risk-management point of view, this was perfect: have a long position in the low-risk asset, and a short one in the higher-risk one. But the reverse happened of what we had expected: AAA tranches went down in price and non-investment-grade tranches went up, resulting in losses as we marked the positions to market.

This was entirely counter-intuitive. Explanations of why this had happened were confusing and focused on complicated cross-correlations between tranches. In essence it turned out that there had been a short squeeze in non-investment-grade tranches, driving their prices up, and a general selling of all more senior structured tranches, even the very best AAA ones.

That mini-liquidity crisis was to be replayed on a very big scale in the summer of 2007. But we had failed to draw the correct conclusions. As risk managers we should have insisted that all structured tranches, not just the non-investment-grade ones, be sold. But we did not believe that prices on AAA assets could fall by more than about 1% in price. A 20% drop on assets with virtually no default risk seemed inconceivable—though this did eventually occur. Liquidity risk was in effect not priced well enough; the market always allowed for it, but at only very small margins prior to the credit crisis.

So how did we get ourselves into a situation where we built up such large trading positions? There were a number of factors. As is often the case, it happened so gradually that it was barely perceptible.

Fighting the last war

The focus of our risk management was on the loan portfolio and classic market risk. Loans were illiquid and accounted for on an accrual basis in the “banking book” rather than on a mark-to-market basis in the “trading book”. Rigorous credit analysis to ensure minimum loan-loss provisions was important. Loan risks and classic market risks were generally well understood and regularly reviewed. Equities, government bonds and foreign exchange, and their derivatives, were well managed in the trading book and monitored on a daily basis.

The gap in our risk management only opened up gradually over the years with the growth of traded credit products such as CDO tranches and other asset-backed securities. These sat uncomfortably between market and credit risk. The market-risk department never really took ownership of them, believing them to be primarily credit-risk instruments, and the credit-risk department thought of them as market risk as they sat in the trading book.

The explosive growth and profitability of the structured-credit market made this an ever greater problem. Our risk-management response was half-hearted. We set portfolio limits on each rating category but otherwise left the trading desks to their own devices. We made two assumptions which would cost us dearly. First, we thought that all mark-to-market positions in the trading book would receive immediate attention when losses occurred, because their profits and losses were published daily. Second, we assumed that, if the market ran into difficulties, we could easily adjust and liquidate our positions, especially on securities rated AAA and AA. Our focus was always on the non-investment-grade part of the portfolio, especially the emerging-markets paper. The previous crises in Russia and Latin America had left a deeply ingrained fear of sudden liquidity shocks and widening credit spreads. Ironically, of course, in the credit crunch the emerging-market bonds have outperformed the Western credit assets.

We also trusted the rating agencies. It is hard to imagine now but the reputation of outside bond ratings was so high that if the risk department had ever assigned a lower rating, our judgment would have been immediately questioned. It was assumed that the rating agencies simply knew best.

We were thus comfortable with investment-grade assets and were struggling with the huge volume of business. We were too slow to sell these better-rated assets. We needed little capital to support them; there was no liquidity charge, very little default risk and a small positive margin, or “carry”, between holding the assets and their financing in the liquid interbank and repo markets. Gradually the structures became more complicated. Since they were held in the trading book, many avoided the rigorous credit process applied to the banking-book assets which might have identified some of the weaknesses.

The pressure on the risk department to keep up and approve transactions was immense. Psychology played a big part. The risk department had a separate reporting line to the board to preserve its independence. This had been reinforced by the regulators who believed it was essential for objective risk analysis and assessment. However, this separation hurt our relationship with the bankers and traders we were supposed to monitor.

Spoilsports

In their eyes, we were not earning money for the bank. Worse, we had the power to say no and therefore prevent business from being done. Traders saw us as obstructive and a hindrance to their ability to earn higher bonuses. They did not take kindly to this. Sometimes the relationship between the risk department and the business lines ended in arguments. I often had calls from my own risk managers forewarning me that a senior trader was about to call me to complain about a declined transaction. Most of the time the business line would simply not take no for an answer, especially if the profits were big enough. We, of course, were suspicious, because bigger margins usually meant higher risk. Criticisms that we were being “non-commercial”, “unconstructive” and “obstinate” were not uncommon. It has to be said that the risk department did not always help its cause. Our risk managers, although they had strong analytical skills, were not necessarily good communicators and salesmen. Tactfully explaining why we said no was not our forte. Traders were often exasperated as much by how they were told as by what they were told.

At the root of it all, however, was—and still is—a deeply ingrained flaw in the decision-making process. In contrast to the law, where two sides make an equal-and-opposite argument that is fairly judged, in banks there is always a bias towards one side of the argument. The business line was more focused on getting a transaction approved than on identifying the risks in what it was proposing. The risk factors were a small part of the presentation and always “mitigated”. This made it hard to discourage transactions. If a risk manager said no, he was immediately on a collision course with the business line. The risk thinking therefore leaned towards giving the benefit of the doubt to the risk-takers.

Collective common sense suffered as a result. Often in meetings, our gut reactions as risk managers were negative. But it was difficult to come up with hard-and-fast arguments for why you should decline a transaction, especially when you were sitting opposite a team that had worked for weeks on a proposal, which you had received an hour before the meeting started. In the end, with pressure for earnings and a calm market environment, we reluctantly agreed to marginal transactions.

Over time we accumulated a balance-sheet of traded assets which allowed for very little margin of error. We owned a large portfolio of “very low-risk” assets which turned out to be high-risk. A small price movement on billions of dollars' worth of securities would translate into large mark-to-market losses. We thought that we had focused correctly on the non-investment-grade paper, of which we held little. We had not paid enough attention to the ever-growing mountain of highly rated but potentially illiquid assets. We had not fully appreciated that 20% of a very large number can inflict far greater losses than 80% of a small number.

Goals and goalkeepers

What have we, both as risk managers and as an industry, to learn from this crisis? A number of thoughts come to mind. One lesson is to go back to basics, to analyse your balance-sheet positions by type, size and complexity both before and after you have hedged them. Do not assume that ratings are always correct and if they are, remember that they can change quickly.

Another lesson is to account properly for liquidity risk in two ways. One is to increase internal and external capital charges for trading-book positions. These are too low relative to banking-book positions and need to be recalibrated. The other is to bring back liquidity reserves. This has received little attention in the industry so far. Over time fair-value accounting practices have disallowed liquidity reserves, as they were deemed to allow for smoothing of earnings. However, in an environment in which an ever-increasing part of the balance-sheet is taken up by trading assets, it would be more sensible to allow liquidity reserves whose size is set in scale to the complexity of the underlying asset. That would be better than questioning the whole principle of mark-to-market accounting, as some banks are doing.

Last but not least, change the perception and standing of risk departments by giving them more prominence. The best way would be to encourage more traders to become risk managers. Unfortunately the trend has been in reverse; good risk managers end up in the front-line and good traders and bankers, once in the front-line, very rarely go the other way. Risk managers need to be perceived like good goalkeepers: always in the game and occasionally absolutely at the heart of it, like in a penalty shoot-out.

This is hard to achieve because the job we do has the risk profile of a short option position with unlimited downside and limited upside. This is the one position that every good risk manager knows he must avoid at all costs. A wise firm will need to bear this in mind when it tries to persuade its best staff to take on such a crucial task.
 
Hi David, Wow : such a complex topic involving Correlation, (PD, Spread) and Equity Value.

After reading all the details in that forum : I am now fine with
1. Equity Tranche : falling in value (Increasing spread, Increasing P.D.) with decreasing correlation.
2. Senior Tranche : Increasing in value (Decreasing Spread, Decreasing P.D.) with decreasing correlation.
3. Mezzanine Tranche : falling in value with decreasing correlation @ lower correlation levels
and : increasing value with decreasing correlation @ higher correlation levels

But i still confused why Correlation Decreased? (why GM, Ford categorization of Junk bonds decreased the correlation.) Should this be assumed as a Market phenomenon that happened or am i missing something? (eg., Correlation increases in crisis times and this was going to be the crisis start 2007-2009).

Here, if I am not wrong, 3 is not entirely correct because -> At low pd, Mezz behaves like senior and at high pd, Mezz behaves like equity
 

Vaishnevi

New Member
Hi David,

As per the article in economists if there was a short squeeze for non investment grade/equity tranches shouldn't the price of these instruments/bonds increase thus decreasing the spread? This is exactly opposite to the fact that as correlation decreases the spread of equity tranches increase. Please do let me know if I am totally off track. I am trying to understand this concept from the past few days:).
 

yzhang

New Member
Hi @David Harper CFA FRM , in your explanation, you suggest that when correlation between loan/bond defaults increases, the Probability of First To Default actually decreases. This makes sense to me. However, This does not seem to take Exposure at Default into consideration?Shouldn’t the value of equity tranche depends more on First Loss Amount rather than Probability of First Default?
 

Hamam

Active Member
Hi David,
Can you please summarize what's happening in the equity, mezzanine and senior tranches as default correlation is increasing. For some reason I'm still not clear with the explanations above. Also in the FRM book it says that hedge fund strategies are going long the equity tranche and short the mezzanine tranche but in the video(BT) you're saying the opposite?
 

Lu Shu Kai FRM

Well-Known Member
Dear @Hamam ,

For your first question, as David explained very clearly, we need to consider two cases (when correlation decreases) - the equity and senior tranches. It is important to focus on the two contrasting products because it is surprising how changes in correlation affect the two tranches differently.

In the case of the equity tranche, with reference to the 1TD trigger, when correlation is one/perfect, the ten bond portfolio can be seen as a single bond and the probability of default/loss (in the case of the tranche) is 1.0%. When correlation DECREASES to zero, the probability of default/loss can be given as 100% - (100% - 1%)^10 = 9.562%. This is because, as long as 1 or more than 1 bond defaults, the equity tranche will suffer losses, which is why the probability of default/loss is given as 100% minus the probability of not defaulting for all ten bonds.

In the case of the senior tranche, with reference to the LTD trigger, when correlation is one/perfect, the probability of default/loss is still 1.0%. When correlation DECREASES to zero, we need the last bond to default for the senior tranche to suffer losses, which is essentially a requirement for all ten bonds to default (you can go read up on CDOs and their waterfall logic). The probability is given by 1.0%^10, which is basically zero.

This is what is happening with the tranches as default correlation is decreasing (I think you should look at it from the decreasing point of view, which is quite simple to understand as well). The contrast in the behaviour of tranches is interesting as when correlation decreases, one tranche experiences increase in probability of loss (equity tranche) → decrease in value → increase in yield spread while the other experiences decrease in probability of loss (senior tranche) → increase in value → decrease in yield spread. In my opinion, the main cause for this is their trigger (1TD vs LTD).

For your second question, I did not read the FRM book so I would not know. Perhaps you can screenshot the paragraph that lists the hedge fund strat?
 
Last edited:

David Harper CFA FRM

David Harper CFA FRM
Subscriber
Thank you @lushukai that's really helpful! @Hamam This thread at https://forum.bionicturtle.com/threads/effect-of-default-probability-on-equity-and-mezzanine.8144/ also has some very helpful explanations, diagrams and links

Re: matching to the video: sorry I just don't have time to cross-reference with my video. Often the video is "superficial" to the reading, whereas you can see in this thread, we are being must more in-depth about a difficult topic. Maybe I was referring to a slightly different long/short arb strategy, but the corresponding video will never go into the depth of this thread. And it is true that this specific illustration has been very challenging to candidates. Thanks,
 

Hamam

Active Member
Dear @Hamam ,

For your first question, as David explained very clearly, we need to consider two cases (when correlation decreases) - the equity and senior tranches. It is important to focus on the two contrasting products because it is surprising how changes in correlation affect the two tranches differently.

In the case of the equity tranche, with reference to the 1TD trigger, when correlation is one/perfect, the ten bond portfolio can be seen as a single bond and the probability of default/loss (in the case of the tranche) is 1.0%. When correlation DECREASES to zero, the probability of default/loss can be given as 100% - (100% - 1%)^10 = 9.562%. This is because, as long as 1 or more than 1 bond defaults, the equity tranche will suffer losses, which is why the probability of default/loss is given as 100% minus the probability of not defaulting for all ten bonds.

In the case of the senior tranche, with reference to the LTD trigger, when correlation is one/perfect, the probability of default/loss is still 1.0%. When correlation DECREASES to zero, we need the last bond to default for the senior tranche to suffer losses, which is essentially a requirement for all ten bonds to default (you can go read up on CDOs and their waterfall logic). The probability is given by 1.0%^10, which is basically zero.

This is what is happening with the tranches as default correlation is decreasing (I think you should look at it from the decreasing point of view, which is quite simple to understand as well). The contrast in the behaviour of tranches is interesting as when correlation decreases, one tranche experiences increase in probability of loss (equity tranche) → decrease in value → increase in yield spread while the other experiences decrease in probability of loss (senior tranche) → increase in value → decrease in yield spread. In my opinion, the main cause for this is their trigger (1TD vs LTD).

For your second question, I did not read the FRM book so I would not know. Perhaps you can screenshot the paragraph that lists the hedge fund strat?
Thanks, I really appreciate it. Will look into this more carefully.
 

MRC2020

New Member
Hi all,

I think @Hamam has a point here as I stumbled across the same issue with respect to the hedge funds strategy.

In the FRM book (p.114) it says:
"lmportantly, the correlation of the bonds in CDOs (...) decreased, since bonds of different credit qualities are typically lower-correlated. This led to huge losses of hedge funds, which had put on a strategy where they were long in the equity tranche of the CDO and short the mezzanine tranche of the CDO."

If I am not mistaken, this strategy (long equity, short mezzanine) would, in fact, result in a double loss when correlation is dropping.
However, in study notes and the video we are talking about going short in the equity tranche and going long in the mezzanine tranche.
Am I missing something?
Thanks!
 
Last edited:

David Harper CFA FRM

David Harper CFA FRM
Subscriber
HI @MRC2020 You may have noticed that above (https://forum.bionicturtle.com/thre...zannine-t-correlation-impact.10203/post-48179) i happen to agree with you. As I compare Gunter's first and second editions, I notice that he switched the hedge funds' strategies. Consequently, I just wrote him the following email; he's typically very helpful. Will keep you posted!

==========================

"Hi Gunter, I hope you are doing well! Can I ask for your help: In your first edition (Chapter 1), about the first correlation-related crisis, you wrote "Importantly, the correlation of the bonds in CDOs that referenced investment grade bonds decreased, since bonds of different credit qualities are typically lower correlated. This led to huge losses of hedge funds, which had put on a strategy where they were short the equity tranche of the CDO and long the mezzanine tranche of the CDO." (Meissner, Gunter. Correlation Risk Modeling and Management: An Applied Guide including the Basel III Correlation Framework - With Interactive Models in Excel / VBA (Wiley Finance) (p. 19). Wiley. Kindle Edition.)

But the second edition reads: "Importantly, the correlation of the bonds in CDOs (which originally were only investment-grade bonds) decreased, since bonds of different credit qualities are typically lower-correlated. This led to huge losses of hedge funds, which had put on a strategy where they were long the equity tranche of the CDO and short the mezzanine tranche of the CDO." (Meissner, Gunter. Correlation Risk Modelling and Management (p. 61). Risk Books. Kindle Edition.)

Previously, I was able to explain the short equity/long mez dynamics at this thread
https://forum.bionicturtle.com/thre...zannine-t-correlation-impact.10203/post-48179

... but apparently you CORRECTED this in the second edition. Any help/interpretation would be great!
Thank you,
David Harper"
 
Top