R31.P1.T4- TUCKMAN CHAPTER 2- Discrete and Continuous Rates and FVs

gargi.adhikari

Active Member
Hi,
In reference to TUCKMAN CHAPTER 2 ( Pg 16):-
I circled back to Tuckman Chapter 2 to double check I covered everything and something caught my eye which I could not reason and I think again there might be a gap in my understanding which is why I am posting this question...
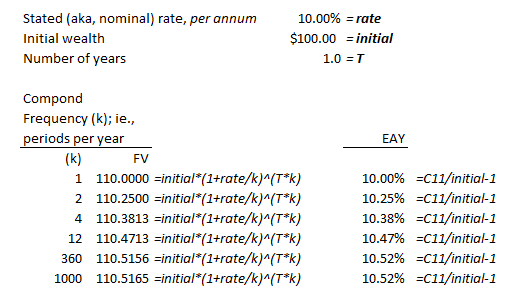
Want to start by saying that, I understand how we derived/calculated the Discrete and Continuous rates for the different Compounding frequencies. However, I am having trouble with the numbers circled in pink.

I tried deriving the FVs/Terminal Values by plugging in the Rm values: PV( 1 + Rm/m)^mT
PV=100, Rm= 9.7618%, m=2 , T= 1 yr. So the FV for Compounding Freq= 2 should be = 100 ( 1+ .097618/2)^2.1 =110.0000318

Similarly, all the other FVs/Terminal Values circled in pink are a bit off...what am I missing here ... :(

Please help :( :(


upload_2016-3-18_17-39-9.png
 

gargi.adhikari

Active Member
@brian.field Thanks so very much Brian for the prompt response and coming to the rescue.. :) but...unfortunately ...I still don't see how you're deriving Col I.
The formula Col D yields Col C ...

upload_2016-3-18_23-39-28.png
 

David Harper CFA FRM

David Harper CFA FRM
Subscriber
Hi @gargi.adhikari I don't blame you, because we actually have a bad label there (sorry). Effective annual rate (aka, effective annual yield) is specifically a per annum rate with annual compounding. It's true that the last two columns (equivalent periodic return and continuous return) do correspond to an effective annual rate of 10.0%, but the terminal value column is not assuming an effective annual rate of 10.0%. The terminal values are assuming a stated (aka, nominal) rate of 10.0% per annum with various compound frequencies. See my quick XLS below. (actual XLS here @ http://trtl.bz/1VocPRX)

Forgetting the table, if the assumption is that the stated (nominal) rate is 10.0%, then increasing the compound frequency (i.e., k periods per year) produces increasing future (terminal) values; each of those implies a higher associated effective annual yield. If you remove the "Terminal Value" column from the table (above, in the study notes), then you have a coherent exhibit of rates which all correspond to the same effective annual yield of 10.0%; e.g., 10.0% EAY = (be definition) 10.0% per annum with annual compounding = 9.531% per annum with continuous compounding = 9.7618% per annum with semi-annual compounding. So simple, but not really ... but satisfying to understand :)

0319-compound-freq2.png
 

gargi.adhikari

Active Member
@David Harper CFA FRM ...that absolutely hit the nail on the head ! I was missing seeing the EAY...this makes perfect sense now ! :)

Thanks again for the clarification ! The Terminal Values are more with the same rate of 10% but if compounded more frequently . While we achieve the same Terminal Value of $ 110 with a lower periodic rate than 10% if compounded more frequently! That was one sweet gotcha :) Thank You again @David Harper CFA FRM for elaborating this point.... :)

Thank you ! Thank you ! :) :)
 
Last edited:

stephenjohn

Member
Hello - Regarding Tuckman Chapter 2, page 23, I think I understand the reason for why the bond prices in the blue area fluctuate, as the coupon rate starts of as being greater than the forward rates, and then end up as being lower than the forward rates later on.

Unfortunately, I do not understand the rationale for the bond price (PV) changes in the table highlighted red as for each time period the coupon rate > forward rate, but somehow decreased from $108.98 to $102.16 between T = 1.0 and T = 1.5.

Is there something I have missed.

Any help on this would be much appreciated.

Many Thanks,

Stephen

upload_2016-8-28_16-45-46.png
 
Top