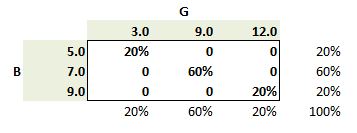
The expected values (aka, means) are each/all the sum of [joint probability * value]. For example, in the case of variable (G), its mean = (20% * 3.0) + (60% * 9.0) + (20% * 12.0) = 8.4%. In case it helps, below I represent the assumption situation in a probability matrix; this assumption set is "simpler" in the sense that non-diagonals in the matrix are zeros.
Variance applies, σ^2(X) = E(X^2) - [E(X)]^2. For example σ^2(B) = E(B^2) - [E(B)]^2 = 50.60 - 7.0^2 = 1.60. I hope that clarifies!
Many thanks Sir ! I was just taken aback by the sudden calculation of variance and the grid confused me for a while about mean calculation. I was able to work it as per your example cited above ! Many thanks for your help !
Hi David. I have another question- just making sure I am getting it correct. This is Miller Chapter 6 Bayesian Analysis Page 101
In the attached screenshot, I see that the grid of the previous question (page 100) is being used for the question given above.
Just want to confirm if this is a typo or there is something that I am missing?
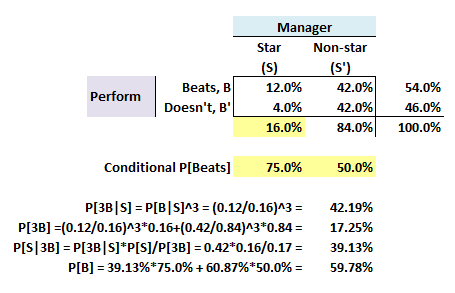
Hi @vaisman (cc @Nicole Seaman ) Apologies, but the upper matrix on page 101 is a mistake and should not be there (you are correct, it's a mistaken copy from the previous sample problem). For sample problem #2, we should be showing only the following matrix (notice that I have colored in YELLOW the three assumptions given: these are all we need to populate the entire matrix!):
And then I notice a second problem, I don't know how this happened but the problem statement omits the following emphasized sentence: "Stars are rare. Of a given pool of managers, only 16% turn out to be stars. A new manager was added to your portfolio three years ago. Since then, the new manager has beaten the market every year." Hence the cubed probability: the probability that a star manager beats the market on any given year is 75%, such that the probability she/he will do that for three consecutive years is 75%^3. In this way, the Bayes theorem applied is P(S | 3B) = P(3B | S)*P(S) / P(3B). Sorry for the confusions, thanks!
Thanks for your amazing real time feedback David ! What I heard about you in many online forums about being prompt and very helpful is cent percent true !
Apologies but I am here to trouble you one more time :
Bayesian Analysis Page 108 (Calculation of P(6B) using this function:
I can't quite understand this calculation as I haven't studied this previously. May I request you to put a full solution or show the full method of solving this?
I interpreted this as (0.75)^6 x (0.25)^4= 0.0007.
Maybe I am missing something but don't know where to search for this. All your help is greatly appreciated and sorry for asking too many questions David !
Sure, frankly I try to respond quickly especially if I think we have an error (as above). Plus, we consider it a contribution (to help us fix mistakes or otherwise improve). In regard to the follow-up: We are given the assumption that "outperformers beat the market 75% of the time" which statistically can be written as a conditional probability, Pr[ Beat | Out-performer]. The above is retrieving the probability that the outperforming manager beats the market in exactly 6 out of 10 years. If the manager has a 50% probability of beating each year, you could think of this as the probability of flipping a coin and getting exactly 6 heads out of 10 flips (except this manager has a 75% probability). Because each year's outcome is a Bernoulli (i.e., either beat or miss, only two outcomes) and this is a series of 10 Bernouillis, this a binomial distribution. So, the formula is applying the binomial distribution (https://en.wikipedia.org/wiki/Binomial_distribution) to find the probability of exactly 6 successes out of 10 trials given p = 0.75. The (10 6) is the binomial coefficient (https://en.wikipedia.org/wiki/Binomial_coefficient) that is "inside" the binomial. Here it equals 10!/(6!*4!) = (10*9*8*7)/(4*3*2) = 210; it means there are 210 combinations of six items that can be drawn from a set of 10 items. The 0.75^6*0.25^4 = 0.000695229 is the probability of an exactly (single) sequence of 6 beats + 4 misses; e.g., "BMBMBMBMBB". But we want to count any sequence with six beats, and there are 210 different sequences to the 210* 0.000695229 = 14.60% is the probability of a combination (as opposed to a permutation) of 6 beats out of 10 years. I hope that's helpful!
Hi @vaisman good morning! I think it's a question that has been discussed many times (I would encourage you to first search the forum, because it's typically impossible for me to answer every question every day, FWIW, so that I try to answer questions that are difficult and/or without obvious precedent), but the short answer is:
Critical (lookup) values will be provided; e.g., GARP's recent practice paper includes a normal Z lookup. But if student's t lookup values are needed, they will be provided
However, you would be expected to know to reject a large computed t (e.g., t = 7 or t = 12), as such a value represents too many standard deviations (away from the hypothesized mean) to accept the null. We generally need the lookup for the zone around t = 2.0; i.e. if the t = 2.0 +/- x, it depends on the d.f. But if t = 5.0 or 15.0, we don't need a table to reject. I hope that's helpful!
Sure, frankly I try to respond quickly especially if I think we have an error (as above). Plus, we consider it a contribution (to help us fix mistakes or otherwise improve). In regard to the follow-up: We are given the assumption that "outperformers beat the market 75% of the time" which statistically can be written as a conditional probability, Pr[ Beat | Out-performer]. The above is retrieving the probability that the outperforming manager beats the market in exactly 6 out of 10 years. If the manager has a 50% probability of beating each year, you could think of this as the probability of flipping a coin and getting exactly 6 heads out of 10 flips (except this manager has a 75% probability). Because each year's outcome is a Bernoulli (i.e., either beat or miss, only two outcomes) and this is a series of 10 Bernouillis, this a binomial distribution. So, the formula is applying the binomial distribution (https://en.wikipedia.org/wiki/Binomial_distribution) to find the probability of exactly 6 successes out of 10 trials given p = 0.75. The (10 6) is the binomial coefficient (https://en.wikipedia.org/wiki/Binomial_coefficient) that is "inside" the binomial. Here it equals 10!/(6!*4!) = (10*9*8*7)/(4*3*2) = 210; it means there are 210 combinations of six items that can be drawn from a set of 10 items. The 0.75^6*0.25^4 = 0.000695229 is the probability of an exactly (single) sequence of 6 beats + 4 misses; e.g., "BMBMBMBMBB". But we want to count any sequence with six beats, and there are 210 different sequences to the 210* 0.000695229 = 14.60% is the probability of a combination (as opposed to a permutation) of 6 beats out of 10 years. I hope that's helpful!
Thank God I found this thread! Was also struggling with the same problem and now it's clear. I think it would be helpful to include the computation for the binomial coefficient in the material itself since this is in Chapter 1 and the binomial distribution is not discussed in detail until Chapter 2.
Hi @iamannchi in the ideal, I am sure you are right, but realistically it's hard to manage all such antecedents. I write a lot of questions that, in an attempt to give cross-topic exposure just don't prequalify some concepts/formulas. It's a trade off compounded by a "dynamic" syllabus (ie, that has changed too rapidly). Thanks,
Hi @iamannchi in the ideal, I am sure you are right, but realistically it's hard to manage all such antecedents. I write a lot of questions that, in an attempt to give cross-topic exposure just don't prequalify some concepts/formulas. It's a trade off compounded by a "dynamic" syllabus (ie, that has changed too rapidly). Thanks,
This site uses cookies to help personalise content, tailor your experience and to keep you logged in if you register.
By continuing to use this site, you are consenting to our use of cookies.