Backtesting Var - practice question

atandon

Member
Hi David,

Pls elaborate more on the answer provided to below question.To my understanding, we should have selected the answer c), since it exceeds the value (5) for 99% confidence. Text highlighted in red is not clear.

207.1. A bank's VaR, calibrated with 99% confidence and a one-day horizon, is $10.0 million. The bank conducted a backtest over the previous 500 trading days in order to ascertain, with 95% confidence, whether the 99% VaR model is good or bad ("faulty"). It is assumed losses are i.i.d. Which backtest observation would MOST LIKELY implicate the VaR model as bad (faulty) with 95% confidence?
a) Never (on no single day) did the daily loss exceed the $10.0 million VaR
b) Only once was the daily loss exactly $10.0 million
c) On exactly eight days the daily loss exceeded the $10.0 million VaR
d) The largest daily loss was over $50.0 million, which is more than 5x the daily VaR

207.1. A. Never (on no single day) did the daily loss exceed the $10.0 million VaR
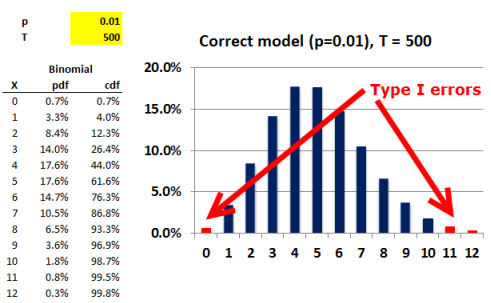
Under i.i.d., a good 99% VaR model would expect 1% * 500 = 5 daily exceptions (exceedences).
The probability of zero exceptions = 99%^500 = 0.657%, which is less than 2.5% (i.e., outside the 5% two-tailed acceptance region).
So, zero exceptions would lead to a "reject null" conclusion.
In regard to (B), (C), and (D), none of these observations implicate the model as faulty: 8 exceptions occurs with 6.5% probability (93.3% cumulatively, which is inside the acceptance region); a single large outlier does not contradict VaR, which says nothing about magnitude of losses in excess of VaR.
 

David Harper CFA FRM

David Harper CFA FRM
Subscriber
Hi atandon,

This goes to the heart of the backtest (and also, fwiw, the FRM does like to test this). I added some further clarification to the source Q&A here, including link to the XLS which renders the chart (below).

First (not to your point, but just the common first hurdle), it's easy to confuse the 99% VaR, which is one-tailed, with the 95% confidence of the backtest, which is two-tailed. I think this is difficult until we grasp the difference. For backtest purposes:
  • 99% VaR simply sets up that we are conducting a hypothesis test (of sample mean) of a binomial distribution with p = 1%
  • 95% is just a choice about the two-tailed significance (desired confidence) of our decision to accept/reject the VaR model
But to your point, the null hypothesis is that the 99% VAR model is good, which expects 1%*500 = 5 exceedences (i.e., 5 days on which the daily loss exceeds the VaR). To observe 5 exceedence over 500 observations would be to observe a model that performs exactly as expected because 5 = n * p = the mean of the binomial distribution. But, the chart below illustrates how we would expect this "correct or good" 99% VaR model to perform (conditional on independence, i.i.d. is a requisite). For example, we would expect a good model to product 8 exceedences with prob = 6.5% = C(500,8)*1%^8*99%^492 = 6.52%, where C(500,8) = 500!/(8!*492!) = (500*499* ... *493)/8!.

Since 8 exceedences can occur with prob of 6.5%, we can't reject the null with 95%; i.e., if the null is true, we still expect this outcome to happen with p = 6.5%
... more specifically, although we don't need to do this calculation, as the CDF P[exceedences 8 or more] = 1 - P(X <= 7) = 86.8%, the one-tailed p-value is a high 13.2%: we could reject the null (find the model faulty) with confidence of 1 - 13.2% = 86.8% or lower, but not greater confidence. It's actually a two-tailed test, but that only makes the two-tailed p value even higher. So, it is true that 8 exceedences is above the mean of 5 and makes us wonder, but we'd reject the null only with a two-tailed confidence of only 100% - (13.2%*2) = 73.5%

Zero exceedences has only prob of 0.7%, which is less than 2.5%; i.e., 95% confidence implies 2.5% reject region on each of the left and right side. In Jorion's Figure 6-2 (where the only difference is T = 250 days), the probability of zero exceedences is 8.1%, which we cannot reject. I hope that explains,

This chart is a variation on Jorion Figure 6-2. The only difference is the backtest conducts over 500 days rather than 250, which changes the prob of zero exceedences from 8.1% (fail to reject at 95% confidence) down to 0.7% (do reject):

0910_t5.207.1_binomial_backtest.png
 
Hi,David, I got a question about the graph above. I though we are supposed to reject the model when x is 10? So in sum,we should reject the model when x is 0, 10, 11 and 12, am I right?? ( in the graph,you only color the red bars when x is 0,11 and 12)

Thank you so much!!!
 

David Harper CFA FRM

David Harper CFA FRM
Subscriber
Hi dadalee,

the prob of X=10 is 1.8%, so if we rejected 10, then our reject region would be equal to, or greater than, 10, which = 1.8%+0.8%+0.3% + ~0 ~= 2.9%.
I did not include 10 because under a two-tailed 5% test, we normally (pun intended!) would allocate 5%/2 = 2.5% to each rejection tail. Since 2.9%>2.5%, it falls inside the acceptance region.
However, that is under the convention of treating the binomial as approximately normal for a large sample.
Your point challenges me: if the left tail rejection includes only the 0.7%, then is 5%-0.7% = 4.3% available for an asymmetric rejection region on the right-tail?
... I don't know the answer. I will try to research it, or I will accept any help, too. Great point! (+star for stumping me!), sorry i can't say immediately. Thanks,
 

vt2012

Member
Hi David,
This thread is a brilliant illustration to what I’m trying to deliver to colleagues for many years:
1. Normal distribution: continuous, F(x=a)=0 (necessarily) by definition !!!
cdf (x<a), cdf (a<x<b), cdf(x>b) not equal to zero

2. Binomial distribution: discrete, F(x=a) not (necessarily) equal to zero

3. I have always supported viewpoint that formulation of H0 hypothesis (like x=x0) for continuous distributions is not quite correct.
For example, H0 x=x0 ;
Question: test hypothesis at any level of significance.
Answer: ALWAYS reject the null hypothesis as formally the probability of x=x0 is zero.

4. What is actually/implicitly asked for is how far can x deviates from x0 ? That’s another issue, and we are coming to confidence interval based on cdf etc.

4. In this case (VAR backtesting, binomial distribution), IMHO, there is a simple and logical approach independent on the type of question.
So, null is: our VAR model is good, test at 95%

1. T=500, p=0.01, what is the probability of x=0 exceptions (95% confidence criteria)?
Answer: probability is 0.66% which is less than 5% (1-0.95) requested.
Null rejected. Admit, we have nothing to do with one/two/left/right tails.

And

1.1 T=500, p=0.01, what is the probability of x=1 exceptions (95% confidence criteria)?
Answer: probability is 3.32% which is less than 5% (1-0.95) requested.
Null rejected. Admit, we have nothing to do with one/two/left/right tails.

But, according to your approach (binomial -> normal if T is large),
z=(1-5)/sqrt(0.05*0.95*250) = -1.8 abs=1.8 < 1.96 which means null should be accepted !??
Of course not


2. T=500, p=0.01, what is the probability of x=9 exceptions (95% confidence criteria)?
Answer: probability is 3.60% which is less than 5% (1-0.95) requested.
Null rejected. Admit, we have nothing to do with one/two/left/right tails.

But, according to your approach (binomial -> normal if T is large),
z=(9-5)/sqrt(0.05*0.95*250 = 1.8 < 1.96 which means null should be accepted !??
Of course not


3. T=500, p=0.01, what is the probability of x=8 and more (i.e x>7) exceptions (95% confidence criteria)?
Answer: probability is 13.23% (see binomial cdf) which is more than 5% (1-0.95) requested.
Null cannot be rejected. Admit, we have nothing to do with one/two/left/right tails.

What about this case? You may apply (binomial -> normal), one-tail, two-tail, even 1.5 tail criteria, BUT 13.23 > 5.

”... I don't know the answer. I will try to research it, or I will accept any help, too.” That’s it.


Hope it helps…
 
Hi vt2012,

sorry, your argument makes me even more confused. So under your example #2, the two different results from using binomial and normal distributions contradict to each other, so which one should we use? and why ?

Hopefully you can explain again, thank you so much!!!
 

vt2012

Member
Hi vt2012,

sorry, your argument makes me even more confused. So under your example #2, the two different results from using binomial and normal distributions contradict to each other, so which one should we use? and why ?

Hopefully you can explain again, thank you so much!!!
 

Attachments

  • BT discussion 2.doc
    103.5 KB · Views: 55
Hi, I still have some questions about the VaR backtesting, and hope you have time to answer some of my questions.
1) Based on the word document you posted on the forum, when you are deciding whether to reject or accept the binomial distrbution, did you base you decision on two-tailed test? or is it one-tailed test?
because it looks like when the prob is less than 5%, you will reject, and if it's higher than 5%, you won't reject, am I right?

Thank you so much!
 

Aleksander Hansen

Well-Known Member
Hi, I still have some questions about the VaR backtesting, and hope you have time to answer some of my questions.
1) Based on the word document you posted on the forum, when you are deciding whether to reject or accept the binomial distrbution, did you base you decision on two-tailed test? or is it one-tailed test?
because it looks like when the prob is less than 5%, you will reject, and if it's higher than 5%, you won't reject, am I right?

Thank you so much!
Two tailed.
 

vt2012

Member
Hi, I still have some questions about the VaR backtesting, and hope you have time to answer some of my questions.
1) Based on the word document you posted on the forum, when you are deciding whether to reject or accept the binomial distrbution, did you base you decision on two-tailed test? or is it one-tailed test?
because it looks like when the prob is less than 5%, you will reject, and if it's higher than 5%, you won't reject, am I right?

Thank you so much!
Hi, Dadalee,

Yes, if probab < 5% --> reject

Sorry for delay
Best
 
Hi David,

I think I will have different solution than yours. Please see below if they are making sense to you.
Here H0: the 99.9% VaR model is good with P=0.01.
Let N=days exceeds the VaR, then N follows Bin(500,0.01), or (N+0.5) approximate to Normal distribution with mean=500*0.01 and std dev=sqrt(500*0.01*0.99).
Given confidence level being 95%, then the critical values will be +/-1.96. Thus the rejection region for H0 will be N>mean+1.96*std dev-0.5 or N<mean-1.96*std dev-0.5.
That way, if N>8.86 or N<0.139, then the H0 is rejected.

The above analysis shows that only a) is right.
Thanks.
 

surajsareen

New Member
Hi David,

I think I will have different solution than yours. Please see below if they are making sense to you.
Here H0: the 99.9% VaR model is good with P=0.01.
Let N=days exceeds the VaR, then N follows Bin(500,0.01), or (N+0.5) approximate to Normal distribution with mean=500*0.01 and std dev=sqrt(500*0.01*0.99).
Given confidence level being 95%, then the critical values will be +/-1.96. Thus the rejection region for H0 will be N>mean+1.96*std dev-0.5 or N<mean-1.96*std dev-0.5.
That way, if N>8.86 or N<0.139, then the H0 is rejected.

The above analysis shows that only a) is right.
Thanks.

Where does the (N+0.5) come from?
 

David Harper CFA FRM

David Harper CFA FRM
Subscriber
Hi @surajsareen I don't know where the (N+0.5) comes from but the source question is here https://forum.bionicturtle.com/threads/p2-t5-207-backtesting-var-topic-review.6055 ie, including the idea that, if we use the normal to approximate, the 95 interval would be 5 +/- 1.96*sqrt(1%*99%*500) = {0.64, 9.36} as the 95.0% confidence interval using 1.96 as the deviate. Although we have n*p = 5 here and I think a common rule of thumb is that n*p > 10 and n*(1-p) > 10 in order to justify the normal approximation. Thanks,
 
Top