GARP.FRM.PQ.P2 2016 Practice exam q 64 volatility smile (garp16-p2-64)

Xin Zhan

Member
Hi David,
for practice exam Q64, would the exam specify the shape of the smile? (e.g. heavy lift tail, lighter right tail). Or are we suppose to know the shape? if yes, could you please advise what's the correct shape of the volatility smile for each type of options? thank you!

64. A committee of risk management practitioners discusses the difference between pricing deep out-of-the-money call options on FBX stock and pricing deep out-of-the-money call options on the EUR/JPY foreign exchange rate using the Black-Scholes-Merton (BSM) model. The practitioners price these options based on two distinct probability distributions of underlying asset prices at the option expiration date:
  • A lognormal probability distribution
  • An implied risk-neutral probability distribution obtained from the volatility smile for options of the same maturity
Using the lognormal, instead of the implied risk-neutral probability distribution, will tend to:

a. Price the option on FBX relatively high and price the option on EUR/JPY relatively low.
b. Price the option on FBX relatively low and price the option on EUR/JPY relatively high.
c. Price the option on FBX relatively low and price the option on EUR/JPY relatively low.
d. Price the option on FBX relatively high and price the option on EUR/JPY relatively high.
 
Last edited by a moderator:

David Harper CFA FRM

David Harper CFA FRM
Subscriber
Hi @cindyzhan I don't think anyone has posted this question before, I haven't seen/focused on it yet that I recall. I would like to say that I believe this is a very good question by GARP about the implied volatility smile. This is not easy, by any stretch, and it really tests an understanding of the concept ... To your point, I think a hard part of this question is the expectation that we'd know something about typical smile patterns. However, note the LOs (and these do go back almost a decade actually, these are not really fresh, emphasis mine):
Chapter 20. Volatility Smiles [MR–17]
After completing this reading you should be able to:
  • Define volatility smile and volatility skew.
  • Explain the implications of put-call parity on the implied volatility of call and put options.
  • Compare the shape of the volatility smile (or skew) to the shape of the implied distribution of the underlying asset price and to the pricing of options on the underlying asset.
  • Describe characteristics of foreign exchange rate distributions and their implications on option prices and implied volatility.
  • Describe the volatility smile for equity options and foreign currency options and provide possible explanations for its shape.
  • Describe alternative ways of characterizing the volatility smile.
  • Describe volatility term structures and volatility surfaces and how they may be used to price options.
  • Explain the impact of the volatility smile on the calculation of the “Greeks.”
  • Explain the impact of a single asset price jump on a volatility smile.

To your question:
  • Yes, I think we should know/remember than typically equity options exhibit a downward slope ("skew" or "smirk") and FX options exhibit a smile. Copied from Hull (see below) with my comment added in green. These are really these only two asset class specific smiles we care about.
  • So in both cases above, the out of the money options are on the left, which tells us the implied distribution has a heavier-than-lognormal left tail With respect to the deep out-of-money call options on FBX stock, please note that we refer to the right-hand side of the equity implied volatility skew (smirk) because to the right is where the strike price is high; on this side, the lognormal (dashed green flat line) will over-price. With respect to the deep out-of-the-money call options on the EUR/JPY FX, we expect a smile such that on either side (deep ITM or deep OTM), the lognormal (dashed green flat line) will under-price.
  • And, then the other hard part is realizing the following: to price the option per the lognormal probability distribution is to use standard (off the shelf) BSM which assumes constant volatility and therefore would exhibit a flat implied volatility smile. So, the correctly given answer requires understanding that, by using the lognormal we are implicitly over-pricing the deeply OTM equity option (i.e., we are using the dotted green line in Fig 20.3 at higher stock prices) and implicitly under-pricing deeply OTM (or ITM for that matter) FX options. I hope that's helpful because this question really gets to the essence of it! Thanks,

1112-implied-vol-smile.png
 
Last edited:
Hi David,

I'm still a bit confused.. since curve for both types of options is same shape then why is it that one is overpriced n other underpriced?

Thanks,
Smita
Hi @cindyzhan I don't think anyone has posted this question before, I haven't seen/focused on it yet that I recall. I would like to say that I believe this is a very good question by GARP about the implied volatility smile. This is not easy, by any stretch, and it really tests an understanding of the concept ... To your point, I think a hard part of this question is the expectation that we'd know something about typical smile patterns. However, note the LOs (and these do go back almost a decade actually, these are not really fresh, emphasis mine):


To your question:
  • Yes, I think we should know/remember than typically equity options exhibit a downward slope ("skew" or "smirk") and FX options exhibit a smile. Copied from Hull (see below) with my comment added in green. These are really these only two asset class specific smiles we care about.
  • So in both cases above, the out of the money options are on the left, which tells us the implied distribution has a heavier-than-lognormal left tail
  • And, then the other hard part is realizing the following: to price the option per the lognormal probability distribution is to use standard (off the shelf) BSM which assumes constant volatility and therefore would exhibit a flat implied volatility smile. So, the correctly given answer requires understanding that, by using the lognormal we are implicitly over-pricing the deeply OTM equity option (i.e., we are using the dotted green line in Fig 20.3 at higher stock prices) and implicitly under-pricing deeply OTM (or ITM for that matter) FX options. I hope that's helpful because this question really gets to the essence of it! Thanks,

1112-implied-vol-smile.png
d
 

David Harper CFA FRM

David Harper CFA FRM
Subscriber
Hi @FrmL2_Aspirant (Smita!) Great point, thank you! I misspoke above (I confused myself :confused:
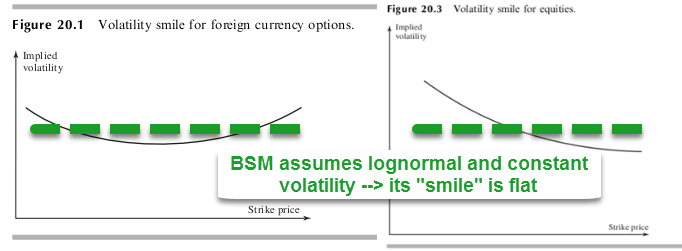
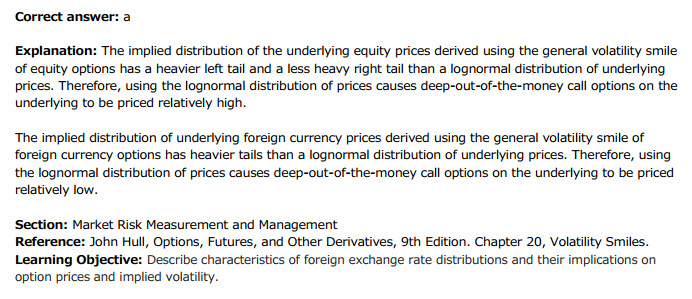
) . We should actually be comparing the right-hand side of the charts. On the right-hand side, you can see they do not have the same shape. I just edited to read the following, please let me know if this doesn't settle it:
  • "So in both cases above, the out of the money options are on the left, which tells us the implied distribution has a heavier-than-lognormal left tail With respect to the deep out-of-money call options on FBX stock, please note that we refer to the right-hand side of the equity implied volatility skew (smirk) because to the right is where the strike price is high; on this side, the lognormal (dashed green flat line) will over-price. With respect to the deep out-of-the-money call options on the EUR/JPY FX, we expect a smile such that on either side (deep ITM or deep OTM), the lognormal (dashed green flat line) will under-price."
 

SODJAN

New Member
Hi David- I am a little confused here.Is C the right answer? I get the part where the dashed lines(suggesting log-normality) are higher for the stock on the right and higher in either case for the currency.However, i would expect that since this is a call option it will be OTM on the right side(High Strike) and ITM on the left (Low Strike) in that case A is the correct answer. Am I thinking about this correctly?
 

David Harper CFA FRM

David Harper CFA FRM
Subscriber
Hi @SODJAN No, in my opinion, not only is the correct answer (A), as given, but it's a strong question. You are correct about an out-of-the-money (OTM) call option: as the X-axis is the strike price, an OTM call option is located on the right-hand side (just as an OTM put would be located on the left-hand side). Please note, however, the difference between the typical smile for an foreign currency (FX) option (Fig 20.1 on the left below) and the typical smirk for an equity option (Fig 20.3 on the right below). For the FX option, the lognormal will underprice because the actual smile line is above the dashed line (which corresponds to the lognormal because it is flat: the BSM assumes constant volatility). But for the equity option, the lognormal will over-price because the actual smirk line is below the flat dashed line. They are directionally different outcomes for the OTM call.

Just to reinforce the idea, suppose instead the question asked about either a deeply ITM call options or deeply OTM put options. In such an alternative case, we would be referring to the left-hand side of both graphs, where both "using the lognormal" approach would underprice as for both the flat-lognormal line is below the higher smile/smirk line. I hope that further clarifies!

1112-implied-vol-smile.png


0206-garp-2016-p2-q64.jpg
 
Last edited:

David Harper CFA FRM

David Harper CFA FRM
Subscriber
@perviz Investopedia's choice of asset (spot) price is not typical. Per Hull, we assume the x-axis of the implied volatility smile is strike price; or just as often K/S, but K/S is directionally the same (eg, to the right is OTM call or ITM put). Here is Hull on alternatives to strike price as X-axis (emphasis mine):
20.4 ALTERNATIVE WAYS OF CHARACTERIZING THE VOLATILITY SMILE There are a number of ways of characterizing the volatility smile. Sometimes it is shown as the relationship between implied volatility and strike price K. However, this relationship depends on the price of the asset. As the price of the asset increases (decreases), the central at-the-money strike price increases (decreases) so that the curve relating the implied volatility to the strike price moves to right (left). For this reason the implied volatility is often plotted as a function of the strike price divided by the current asset price, K/S(0). This is what we have done Figures 20.1 and 20.3.

A refinement of this is to calculate the volatility smile as the relationship between the implied volatility and K/F(0), where F(0) is the forward price of the asset for a contract maturing at the same time as the options that are considered. Traders also often define an ‘‘at-the-money’’ option as an option where K=F(0), not as an option where K=S(0). The argument for this is that F(0), not S(0), is the expected stock price on the option’s maturity date in a risk-neutral world. Yet another approach to defining the volatility smile is as the relationship between the implied volatility and the delta of the option (where delta is defined as in Chapter 19). This approach sometimes makes it possible to apply volatility smiles to options other than European and American calls and puts. When the approach is used, an at-the-money option is then defined as a call option with a delta of 0.5 or a put option with a delta of 0.5. These are referred to as ‘‘50-delta options.’’ -- Hull, John C.. Options, Futures, and Other Derivatives (Page 437). Pearson Education. Kindle Edition.
 

firsova

New Member
Hello,

Where I can find the answer for GARP's tough, good practice question on implied volatility which is given at the end of Hull's chapter 20? The link is obsolete.

Regards,
Valeria
 

Nicole Seaman

Director of CFA & FRM Operations
Staff member
Subscriber
Hello,

Where I can find the answer for GARP's tough, good practice question on implied volatility which is given at the end of Hull's chapter 20? The link is obsolete.

Regards,
Valeria
Hello @firsova

I moved your question here to the forum thread that you were looking for. I tested the link in the notes, and it brought me right to this thread.

Nicole
 

rishikamlk

New Member
Hi @cindyzhan I don't think anyone has posted this question before, I haven't seen/focused on it yet that I recall. I would like to say that I believe this is a very good question by GARP about the implied volatility smile. This is not easy, by any stretch, and it really tests an understanding of the concept ... To your point, I think a hard part of this question is the expectation that we'd know something about typical smile patterns. However, note the LOs (and these do go back almost a decade actually, these are not really fresh, emphasis mine):


To your question:
  • Yes, I think we should know/remember than typically equity options exhibit a downward slope ("skew" or "smirk") and FX options exhibit a smile. Copied from Hull (see below) with my comment added in green. These are really these only two asset class specific smiles we care about.
  • So in both cases above, the out of the money options are on the left, which tells us the implied distribution has a heavier-than-lognormal left tail With respect to the deep out-of-money call options on FBX stock, please note that we refer to the right-hand side of the equity implied volatility skew (smirk) because to the right is where the strike price is high; on this side, the lognormal (dashed green flat line) will over-price. With respect to the deep out-of-the-money call options on the EUR/JPY FX, we expect a smile such that on either side (deep ITM or deep OTM), the lognormal (dashed green flat line) will under-price.
  • And, then the other hard part is realizing the following: to price the option per the lognormal probability distribution is to use standard (off the shelf) BSM which assumes constant volatility and therefore would exhibit a flat implied volatility smile. So, the correctly given answer requires understanding that, by using the lognormal we are implicitly over-pricing the deeply OTM equity option (i.e., we are using the dotted green line in Fig 20.3 at higher stock prices) and implicitly under-pricing deeply OTM (or ITM for that matter) FX options. I hope that's helpful because this question really gets to the essence of it! Thanks,

1112-implied-vol-smile.png
what a simple and amazing explanation..... thanks i have my exam tomo!!
 

TatjanaVitkovic

New Member
Hi @SODJAN No, in my opinion, not only is the correct answer (A), as given, but it's a strong question. You are correct about an out-of-the-money (OTM) call option: as the X-axis is the strike price, an OTM call option is located on the right-hand side (just as an OTM put would be located on the left-hand side). Please note, however, the difference between the typical smile for an foreign currency (FX) option (Fig 20.1 on the left below) and the typical smirk for an equity option (Fig 20.3 on the right below). For the FX option, the lognormal will underprice because the actual smile line is above the dashed line (which corresponds to the lognormal because it is flat: the BSM assumes constant volatility). But for the equity option, the lognormal will over-price because the actual smirk line is below the flat dashed line. They are directionally different outcomes for the OTM call.

Just to reinforce the idea, suppose instead the question asked about either a deeply ITM call options or deeply OTM put options. In such an alternative case, we would be referring to the left-hand side of both graphs, where both "using the lognormal" approach would underprice as for both the flat-lognormal line is below the higher smile/smirk line. I hope that further clarifies!

1112-implied-vol-smile.png


0206-garp-2016-p2-q64.jpg
Could you please explain difference in ATM implied volatility? Thanks
 
Last edited by a moderator:

David Harper CFA FRM

David Harper CFA FRM
Subscriber
@TatjanaVitkovic I re-read this thread from the beginning and, sorry, I just don't even know what you are asking. I can't related it to the portion you quoted, or to the GARP extract !? On the horizontal x-axis is the strike price such that at-the-money (ATM) is near to the center. In regard to ATM call options, we could:
  • For the FX option, infer that the lognormal model will over-price (in the middle, the straight dashed line is above the curved line)
  • For the equities option, we cannot exactly say but the lognormal model might be roughly accurate (because that's where the lines intersect approximately). Hope that's helpful,
 

yLam4028

Active Member
Hello David, I just finished the reading and tried this challenging question.
I chose (C) because due to crashophobia the right-end of the volatility smile would tilt up, and so lognormal distribution will consistently undervalue ANY out of the money calls.
Based on the diagrams you showed here should I forget about crashophobia on equity option i.e. it is a downward skewed

And when we say BSM undervalues FX OTM call option with lognormal distribution, do we also say we underestimate in the money put option as call & put share the same volatility smile?

[ edited on Apr 19. retried the question and got it correct + new insight
for equity:
The typical download sloping curve implies the leverage effect is more significant than the crashophobia.
The higher prices for ITM options with lower strike price are driven by lower equity price and a higher leverage.
There is no tilting at the far end OTM side indicates crashophobia is not significant.
And since the result price distribution is positive skewed, the market is pricing a smaller probability for OTM event, BSM will overprice the option.

for FX:
the tilting at the far end OTM side indicates crashophobia is significant.
The result price distribution has smaller mass in the center. The market is pricing a larger probability for OTM event, BSM will underprice the option.
]
 
Last edited:

rajvar67

New Member
Just to re-confirm my understanding, in the Figure 20.1 and 20.3, are below correct?
  • Dashed Green Flat line -> is a lognormal probability distribution
  • Black line (smile and skew) -> is an implied risk-neutral probability distribution obtained from the volatility smile for options of the same maturity
and if the question is framed vice versa, I mean, using an implied risk-neutral probability distribution instead of Lognormal, then answer would be
-> Price of FBX Stock OTM Call option would be low and FX OTM Call option would be high. However, OTM Put on both will be high.

Please confirm.
 

gsarm1987

FRM Content Developer
Staff member
Subscriber
Just to re-confirm my understanding, in the Figure 20.1 and 20.3, are below correct?

  • Dashed Green Flat line -> is a lognormal probability distribution
  • Black line (smile and skew) -> is an implied risk-neutral probability distribution obtained from the volatility smile for options of the same maturity
and if the question is framed vice versa, I mean, using an implied risk-neutral probability distribution instead of Lognormal, then answer would be
-> Price of FBX Stock OTM Call option would be low and FX OTM Call option would be high. However, OTM Put on both will be high.

Please confirm.
you are correct, so let me clarify further: Blackscholes>>normal distribution>>volatility is constant. green line. if you solved for volatility based on option prices available that will show the smile/skew/frawn etc. key is, implied volatility is flatlined (thanks to blackscholes) any different shape is due to market forces playing on option premiums .

your last point: "-> Price of FBX Stock OTM Call option would be low and FX OTM Call option would be high. However, OTM Put on both will be high." since volatility moves the premiums through time value component of the premium (the other component is intrinsic, we know that OTM means intrinsic is nil so we left with time value part) , the black curve can take cany shape. say if volatility in OTM puts and OTM calls is high you have smile, if its low at these ends, then a drawn. if its high at OTM puts and less for OTM Calls that's a skew. Please also see Daid's comment above, from Feb 2018. Let me know if it makes sense?
 
Top