AIM: Compare, contrast and calculate parametric and non-parametric approaches for estimating conditional volatility, including: ... Historic simulation; Multivariate density estimation; Hybrid methods
Questions:
326.1. Below are the ordered daily returns for the worst ten (10) returns among a window of one hundred returns (n = 100). Under Linda Allen's hybrid approach, the weights are determined by assuming a lambda parameter of 0.940.
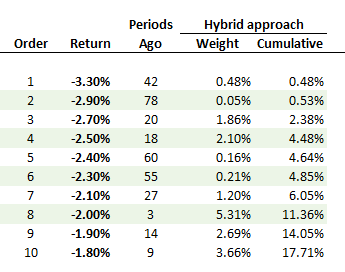
Which is NEAREST to 95.0% value at risk (VaR) under the hybrid approach?
a. 2.10%
b. 2.28%
c. 2.35%
d. 2.40%
326.2. The multivariate density estimation (MDE) method estimates conditional volatility according to the following function:
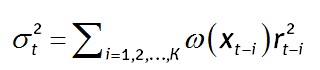
Each of the following is TRUE about this multivariate density estimation (MDE) approach to volatility EXCEPT which is false?
a. MDE is similar to GARCH because it assigns different (i.e., non-constant) weights to a series of of historical (squared) returns
b. MDE is similar to GARCH because distant observations receive less weight than recent observations
c. MDE is different than GARCH because the weighting (kernel) function is not a function of time
d. MDE is flexible because user can specify economic state variables, but it is thusly data intensive
326.3. Analyst Scott is employing a hybrid approach (i.e., hybrid of HS and EWMA) in order to estimate volatility. His historical window includes 100 return observations. What is the effect on the hybrid 95.0% value at risk (VaR) if he reduces the lambda parameter from 0.94 to 0.88?
a. The VaR decreases; i.e., the interpolated loss return shifts from more negative to less negative
b. No impact on the VaR
c. The VaR increases; i.e., the interpolated loss return from less negative to more negative
d. Unclear, depends on dataset
Answers:
Questions:
326.1. Below are the ordered daily returns for the worst ten (10) returns among a window of one hundred returns (n = 100). Under Linda Allen's hybrid approach, the weights are determined by assuming a lambda parameter of 0.940.
Which is NEAREST to 95.0% value at risk (VaR) under the hybrid approach?
a. 2.10%
b. 2.28%
c. 2.35%
d. 2.40%
326.2. The multivariate density estimation (MDE) method estimates conditional volatility according to the following function:
Each of the following is TRUE about this multivariate density estimation (MDE) approach to volatility EXCEPT which is false?
a. MDE is similar to GARCH because it assigns different (i.e., non-constant) weights to a series of of historical (squared) returns
b. MDE is similar to GARCH because distant observations receive less weight than recent observations
c. MDE is different than GARCH because the weighting (kernel) function is not a function of time
d. MDE is flexible because user can specify economic state variables, but it is thusly data intensive
326.3. Analyst Scott is employing a hybrid approach (i.e., hybrid of HS and EWMA) in order to estimate volatility. His historical window includes 100 return observations. What is the effect on the hybrid 95.0% value at risk (VaR) if he reduces the lambda parameter from 0.94 to 0.88?
a. The VaR decreases; i.e., the interpolated loss return shifts from more negative to less negative
b. No impact on the VaR
c. The VaR increases; i.e., the interpolated loss return from less negative to more negative
d. Unclear, depends on dataset
Answers:

")
")