Negative convexity

shanlane

Active Member
Hello,

Do IOs ever have positive convexity? I have seen the P/Y graph for POs, but really cannot find one for IOs. POs have pos convexity at higher yields and neg convex at low yields but I am not sure at all what the P/Y graph for an IO looks like.

Also, this may be a very dumb question, but what are the mechanics behind an IO increasing in value as rates increase? The basic idea is that there will be no premayments and this will exten the period in which you are getting paid interest, but wont this also make the payments less valuable because they will be discounted at a higher rate?

Now that I think about it, why would POs have negative convexity? The faster the pre-payments come in (as rates fall), the faster the investors will be repaid, so wouldn't this result in positive convexity?

Thanks!

Shannon
 

David Harper CFA FRM

David Harper CFA FRM
Subscriber
Hi Shannon,

Interesting. Don't quote me (when I get time after the videos, I'll expand my XLS to include Veronesi's IO/PO strips because I am interested in seeing this myself), but: Yes. I think convexity for both the IO/PO often alternates positive/negative.

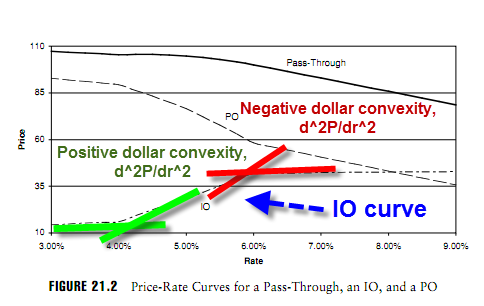
Are you sure you mean convexity and not duration; i.e., the unique feature of an IO is that, unlike most fixed income assets, an IO generally has negative duration, as we can observe from Tuckman's Fig 21.2:

tuckman_io_0405.png


The generally negative (positive) duration of the IO (PO) can be seen by the fact that price is generally an increasing (decreasing) function of the rate; i.e., as the slope of the tangent line is dollar duration, and as duration = -1/P*dollar duration, you can see that the slope of an IO tangent is generally positive (dollar duration) which corresponds to a negative duration.

Convexity is trickier, but if we restrict to negative/positive, we can visualize the dollar duration as the slope of the tangent line, at a point; then positive dollar convexity (as the 2nd derivative) would refer to a dollar duration (slope of tangent line) that is an increasing function of the rate. This visualizing, in my opinion, clearly occurs; but also, as clearly, segments of negative dollar convexity. And, if I eyeball Veronesi Table 8.7, it seems to me the IO value column is manifesting both, alternative, negative and positive convexity. Convexity (and duration), we want to keep in mind, are complicated by the fact that the slope and change in the slope are dollar duration and dollar convexity; but duration and convexity are "infected" by the price divisor, 1/P.

But, i am fairly confident based on eyeballing Table 8.7 that: (i) Veronesi produces IOs and POs that seem to each exhibit alternating negative/positive convexity and (ii) it is also a function of the PSA assumption. Thanks,
 

David Harper CFA FRM

David Harper CFA FRM
Subscriber
Hi Shannon - It looks like you edited your question while i was taking a long time to write an answer to your first question. Your new add-on questions are more fundamental. There is indeed a diminishing impact due to the discounting, such that as rates get higher, you can see in the above exhibit, the IO tends to be constained to an almost horizontal asymptote . But this is not the only factor. In Veronesi, a key factor is that the PSA rate in decreasing (lower prepayment) with higher rate. I think it's very difficult to arrive at an intuition based on one factor. And I think it is very difficult to intuit the convexity; it's impossible to inuit convexity without first grasping duration and dollar duration. All in, i almost prefer Tuckman's approach to "simply" decompose the pass-thru into two pieces. Thanks,
 

shanlane

Active Member
The duration of both of these make perfect sense, although it still seems like a REALLY high increase in yields would give the IOs a positive duration (assume zero refinancing at that point and high discout rates, I would think this could decrease their value), but that may be beyond our scope. It is just what happens in the extremes that was confusing me (when we get away from the appx linear middle portion of each of these graphs).

Thanks again, especially for the graph!

Shannon
 

southeuro

Member
Hey David,

Here's a question I ran into from 2007 FRM part II (age of antiquity):

MBS negative convexity implies:
1. the value of the MBS decreases more than the value of plain-vanilla fixed income as interest rates rise.
2. the value of the MBS decreases less than the value of plain-vanilla fixed income as interest rates rise.
3. the value of the MBS increases less than the value of plain-vanilla fixed income as interest rates fall.
4. the value of the MBS increases more than the value of plain-vanilla fixed income as interest rates fall.

Answer is given as 1 and 3 correct. I understand that prepayments (essentially a short call option from MBS issuer's perspective) render #3 correct. I thought that MBS behave like plain-vanilla fixed-income securities otherwise though (i.e when interest rates rise) so can't get my head around #1 being correct over #2.

Now if anything.. I "feel" closer to #2 because the more interest rates rise, the more out of the money the call option becomes, hence the lesser likelihood that the MBS will be "called"? Still overall I think MBS should be similar to plain vanilla on the rising interest rates side of the graph...

Thanks!
 

David Harper CFA FRM

David Harper CFA FRM
Subscriber
Hi @southeuro

Right, exactly. I don't think you would see this question on the current exam due to the ambiguity of (1) and (2) just as you suggest. The "testable" component concerns (3) and (4): the negative convexity that clearly associates with prepayment at low rates because borrowers are exercising their options to prepay.

I think the question is technically correct because it is asking what negative convexity implies. So, if the price/yield curve exhibit negative convexity throughout, including at high yields, then by mathematical definition (1) must be true. Negative convexity, as a second derivative of price with respect to yield (divided by price), can be viewed as "working against" the investor in the same way they are short the call option held by borrowers. Just like being short an option (short gamma --> the curvature is working against you in all locations), if the MBS is consistently negatively convex, then by this definition, it must be true that "the value of the MBS decreases more than the value of plain-vanilla fixed income as interest rates rise."

The problem, and why you wouldn't see that question today is that it's not obvious that the negative convexity would extend at higher rates. Tuckman explains why positive convexity might occur such that (2) would be true; Veronesi shows a model that reinforces (1). I think it would depend on the PSA assumption (constant at higher rates?). Just like at low yield, the "problem" is the non-financial dynamic: borrowers are not financially optimal, they will exercise at both high/low yields regardless of whether it's financially optimal. This is basically Fabozzi's definition of turnover: prepayment due to factors other than rates. While at the lower rates, this serves only to dampen the inevitable negative convexity, it's unclear whether this financial non-optimal prepayment at high rates (which benefits investors) would overwhelm the slightly natural negative convexity of the option (to agree basically with the financial implication of your last "the more out of the money the call option becomes, hence the lesser likelihood that the MBS will be "called"). I hope that explains why I think the Q&A is technically correct but realistically unlikely, thanks!
 
Top