N(d1) option delta (Instructional Video: Option Sensitivity Measures: The “Greeks”)

AUola2165

Member
Subscriber
Hello,

in the video "Instructional Video: Option Sensitivity Measures: The “Greeks”", there is this slide:
1695145380944.png
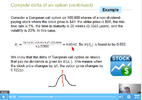
I am confused as to what normal distribution it refers to? Considering that N(d1) comes out to be 0.522, I understand that in the conditional density function, 52.2% of the values are "to the left" of the value. How should I view this in a normal distribution? What are the values on this distributions "x" axis?
 
Hi @AUola2165 The d1 is effectively a standardized Z such that N(d1) is the CDF for a standard normal distribution. Like the d2 (which has a more intuitive direct interpretation: d2 is the normalized distance-to-strike price or, in the Merton model, distance-to-default). Both d1 and d2 have in their numerator effectively a continuous return--e.g., ln(49/50) = -2.0% is a continuous return if we didn't have an time component [aka, -2.0% is the instantaneous continuous return from 50 to 49]--and the denominator is the time-scaled volatility. So, effectively, just as Z = (X - μ)/σ is a standardization, so does d1 = %return_continuous/%σ generate a standard normal Z . I,m being a tad metaphorical re: the d1, okay, whereas this is more literally true for the d2 (as it drags volatility and is used in the physical Merton).

d2 is easier to explain. Here, I think d2 = -0.07 = -0.87% / 12.40% where -0.87% is (geometric) expected continuous return (aka, raw continuous return) which is standardized by dividing by 12.40% volatility such that the expected (geometric) return is -0.070 standard standard deviations away from zero!

Okay, since they are standard normals, they are unitless: a return is divided by a return volatility (the % units cancel). The standard normal has no parameters, all are ~N(0,1^2). Hope that's helpful,
 
Last edited:
If I understand correctly, the d2 is the Z-value to be looked up in the Z-table to find the probability ( i.e. N(d2)) that the strike price is in the money. And d1 is the Z-value to be looked up in the Z-table to find the probability (i.e. N(d1)) that the stock price is above the strike price at expiration.

I have difficulties to intuitively understand the calculations. Why is the risk free rate and volatility^2/2 added together when calculating d1 and subtracted when calculating d2+

Considering the formula for d1 below (to simplicity's sake, I have ignored scaling volatility to time i.e. i have assumed a period of 1 year)

d1 = (ln(stock price/strike price)+(risk free rate+volatility^2/2)) / volatility

and the formula for d2:

d2 = (ln(stock price/strike price)+(risk free rate-volatility^2/2)) / volatility
 
Hi @AUola2165 As I mentioned, because N(.) is a cumulative standard normal distribution function, both N(d1) and N(d2) are instances of N(Z); i.e., both d1 and d2 are quantiles of a cumulative standard normal. For example, as N(2.33) = 99%, the 2.33 is a Z-value (i.e., a quantile on the standard normal distribution) that corresponds to a Z value on the table that I tend to call a Z-lookup.

In terms of the intuition you are asking about, only N(d2) has an easy interpretation because its numerator is the stock price's lognormal process; see my explainer here at https://forum.bionicturtle.com/threads/merton-model-a-summary-of-the-issues.5646/ (this is Merton but I show the connection).

N(d1) requires engagement with the math. For me, the nearest to an intuition is to recognize that it is the (call) option's delta so it is a first derivative (boom! we are more than halfway there ...). Trying to intuit N(d1) from the decontextualized basis of your red +/- alone is impossible to my knowledge.

See my video here https://forum.bionicturtle.com/thre...-n-d1-and-n-d2-in-black-scholes-merton.22471/ Thanks,
 
Last edited:
Top