Sergio Guerrero
New Member
Hi:
Is it possible to find out the standard deviation and expected return of the market portfolio by setting the first derivative of the Sharpe-ratio equal to “0”and solving for the weight of the first asset? And if so, is there an easier way? Thank you,
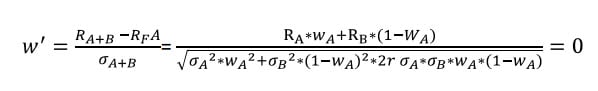
I attached a word document because could not paste the formula")
Note from Nicole: I added the image to your post for you @Sergio Guerrero")
Is it possible to find out the standard deviation and expected return of the market portfolio by setting the first derivative of the Sharpe-ratio equal to “0”and solving for the weight of the first asset? And if so, is there an easier way? Thank you,
I attached a word document because could not paste the formula
Note from Nicole: I added the image to your post for you @Sergio Guerrero
Attachments
Last edited by a moderator:
 I ran the numbers again and came up with a weight of 37.5% . Would Excel solver work for solving problems like this one?