Hi David,
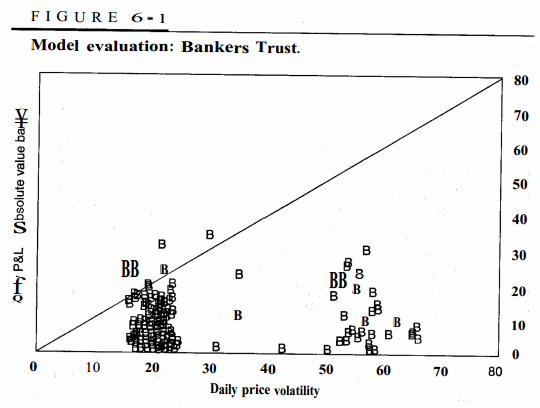
Ref : Jorion ValueAtRisk - Ch6 : Figure : Model Evalution - Bankers Trust
I am not able to follow this example : Kindly Explain the graph if possible (my questions below).
1) The graph is plotted between Daily P&L against 99% VaR. Isn't VaR a single number representing limit. I dont know if the" Diagonal Line" is representing that limit? Very confusing to visualize how that limit is represented by a line for "changing Vol in the X Axis".
2) Assuming that line represents the 99%VaR then the points above the line --> should be the exceptions would be my interpretation. There are 5 points above the line (whereas the author says 4 Exceptions are observed).
2a) Also can you confirm what the author mentions as 2% should lie above the line. Is it 1% loss exceptions and 1% Gain Exceptions on a year (2 days per 250)?
3) Losses and Gains are expressed in Absolute limits to hide the directions of the positions. --> how can profit be in the exception category. VaR is calculated only on the Loss side (One sided confidence limit).
Updated by Nicole to include graph (when referring to a specific graph or image, please provide the image in your question so David and other members know what you are referring to)

Last edited by a moderator:
