GARP Practice Exam 2017 - Q36

Hi David,

This is GARP Practice Exam 2017 Q36.

Bank A and Bank B are two competing investment banks that are calculating the 1-day 99% VaR for an at-the- money call on a non-dividend-paying stock with the following information:

• Current stock price: USD 120
• Estimated annual stock return volatility: 18%
• Current Black-Scholes-Merton option value: USD 5.20
• Option delta: 0.6

To compute VaR, Bank A uses the linear approximation method, while Bank B uses a Monte Carlo simulation method for full revaluation. Which bank will estimate a higher value for the 1-day 99% VaR?

A. Bank A
B. Bank B
C. Both will have the same VaR estimate
D. Insufficient information to determine

May I ask why linear approximation method(delta normal) will always give higher VaR than Monte Carlo? Thx!
 

David Harper CFA FRM

David Harper CFA FRM
Subscriber
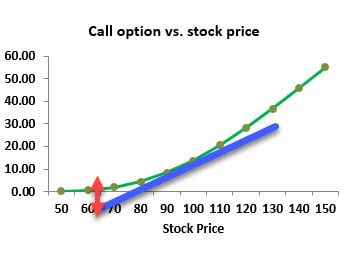
Hi @Unusualskill This is a good, classic FRM question except it should explicate this is a long position (because the linear approximation will understate the VaR for a short position!). The MCS for full revaluation suggests that method will be highly accurate. See below. The option has curvature (aka, gamma). VaR is concerned with the loss, so we care about a drop in the stock price. The blue line illustrates the implications of a delta-based VaR (linear approximation): it will understate the value, and hence overstate the loss (VaR). I hope that clarifies (I am adding to our notes feedback that I think the question wants to make explicit the long position). Thanks,

1115-garp17-p1-36.jpg
 

Branislav

Member
Dear David and Nicole,
I will kindly ask for help to understand answer on practice question nb 36, from 2018 GARP practice exam:

Bank A and Bank B are two competing investment banks. The banks are calculating the 1-day 99% VaR for an
at-the-money call option on a non-dividend-paying stock with the following information:
• Current stock price: USD 120
• Estimated annual stock return volatility: 18%
• Current Black-Scholes-Merton option value: USD 5.20
• Option delta: 0.6
To compute VaR, Bank A uses the linear approximation method, while Bank B uses a Monte Carlo simulation
method for full revaluation. Which bank will estimate a higher value for the 1-day 99% VaR?
A. Bank A
B. Bank B
C. Both will have the same VaR estimate
D. Insufficient information to determine


Answer is under A. "....
The option’s return function is convex with respect to the value of the underlying.
Therefore, the linear approximation method will always underestimate the true value of
the option for any potential change in price and the VaR will always be higher under the
linear approximation method than a full revaluation conducted by Monte Carlo
simulation analysis..."

If it VaR linear method always underestimate option value, thaan I will expect for linear method to be lower in VaR estimation compering to MC?
Would you be kind also to explain this?


"..
The difference is the bias resulting from the linear approximation,
and this bias increases in size with the change in the option price and with the holding
period..."


Thanks a lot in advance
 

Nicole Seaman

Director of CFA & FRM Operations
Staff member
Subscriber
Dear David and Nicole,
I will kindly ask for help to understand answer on practice question nb 36, from 2018 GARP practice exam:

Bank A and Bank B are two competing investment banks. The banks are calculating the 1-day 99% VaR for an
at-the-money call option on a non-dividend-paying stock with the following information:
• Current stock price: USD 120
• Estimated annual stock return volatility: 18%
• Current Black-Scholes-Merton option value: USD 5.20
• Option delta: 0.6
To compute VaR, Bank A uses the linear approximation method, while Bank B uses a Monte Carlo simulation
method for full revaluation. Which bank will estimate a higher value for the 1-day 99% VaR?
A. Bank A
B. Bank B
C. Both will have the same VaR estimate
D. Insufficient information to determine


Answer is under A. "....
The option’s return function is convex with respect to the value of the underlying.
Therefore, the linear approximation method will always underestimate the true value of
the option for any potential change in price and the VaR will always be higher under the
linear approximation method than a full revaluation conducted by Monte Carlo
simulation analysis..."

If it VaR linear method always underestimate option value, thaan I will expect for linear method to be lower in VaR estimation compering to MC?
Would you be kind also to explain this?


"..
The difference is the bias resulting from the linear approximation,
and this bias increases in size with the change in the option price and with the holding
period..."


Thanks a lot in advance
Hello @Branislav Please note that I moved your question to this thread, which I believe answers your question. This question was also in the 2017 practice exam. You will notice that many of the GARP practice questions have been carried over each year. Also notice that we use tags in our posts (at the top of the thread). For example, this shows garp14-p1-19, garp17-p1-36 and garp18-p1-36. These show the year (garp18), the part (p1) and the question number (36). You can use these tags or our search function to see if the questions have already been posted. I hope this is helpful!

Nicole
 

David Harper CFA FRM

David Harper CFA FRM
Subscriber
Great move @Nicole Seaman Hopefully @Branislav your question is already above. I think one of the potential confusions here is: are we talking about the re-estimated value of the option or the re-estimated loss? When the stock price drops, the linear approximation implies a lower value (blue line) which corresponds to a higher loss (i.e., higher VaR). As such, under a negative price shock, the linear (delta) approximation will underestimate the option's value, which is to say it will over-estimate the VaR. IMO, the burden is on the question to be very careful and specific. But this question does ask about the VaR, which we know to be the loss( and further by convention we express the loss as a positive value). If it's interesting, it happens to be that just yesterday I just recorded a new YouTube on gamma, where i finish by employing delta-gamma Taylor series to "fill the curvature gap." See https://trtl.bz/2SkUgAa Thanks!
 

Branislav

Member
Dear David thanks a lot! blue and read line does explain everything, independently from the terminology..in addition to this i will kindly ask for one more advice: using BT and referenced books, I will expect to get a long well with concepts and understanding of exam objectives, but the problem for me is speed during exam...on average 2.4 min is to small amount of time for me , especially when the questions are little bit tricky like this ...I will appreciate a lot any advice how to overcome this issue...EXAM simulation I suppose is the only answer..do you provide something similar? Thanks once more in advance for helping
 

akrushn2

Member
I maybe understanding this incorrectly but "When the stock price drops, the linear approximation implies a lower value (blue line) which corresponds to a higher loss (i.e., higher VaR). " I would assume that if you are estimating a lower value for your stock your losses computed from that lower value would therefore be also correspondingly lower would it not?
 
Top