Garp 2014 Q19 practice

Tipo

Member
Subscriber
Bank A and B are both calculating 1 day 99% VAR for ATM no dividend call
A is using linear approx method
B is using monte carlo simulation for full revaluation

Stock price USD 120
Annual return volatility 18%
Current BSM option value 5.2USD
Option Delta 0.6

Which bank will have a higher 1 day 99% VAR
The ans is Bank A

But i dont quite understand why. Would you be able to explain?
 

Shoodan83

New Member
Hi Tipo,

thank you for writing your question in the forum.
I have tried to solve the problem, but i have problems too.
My Solution:

A) 0,6 * (2,33 * 0,18 * (1/sqrt(250)) * 120 = 1,9098 (VAR 99%, 1 day)
B) here is my problem
f = max (0, S(T) - K) => K = 114,80
But what has to be full revaluated now?

Can I use this formel:
( Return for one day of the options - 2,33 * (Vola of one day)) * f
or
Black Schooles with an changed parameter (-2,33 * x)
(delta = N(d1) => r = ... => d1', d2' => c = y; => y - 5,2 = VAR(99%, 1 day?)


Best Regards

Matthias
 

David Harper CFA FRM

David Harper CFA FRM
Subscriber
@Tipo

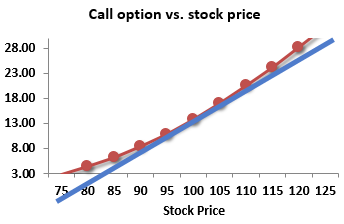
Calculations aren't required. Below is typical plot of ATM call option (in red) in has the typical curvature (characterized by gamma). A linear approximation estimates the loss using delta (the slope of the blue tangent line); i.e., at price decreases, estimated linear price is less than actual price. "Full revaluation" is code for "assume we'll find an answer very near to the actual" In my opinion, the one weakness of the question (the argument for D in fact) is that it does not (it should) specify we are referring to a long position in an ATM call option. Because if the Banks have instead short positions, then the linear approximation returns a higher price (and a lower VaR) so the answer is the opposite for a short option position. I hope that helps,

1029_optionDelta.png
 

Tipo

Member
Subscriber
....then the linear approximation returns a higher price (and a lower VaR)....

Why is this so? My understanding is that a higher price = higher dollar value at risk
 

David Harper CFA FRM

David Harper CFA FRM
Subscriber
Hi @Tipo

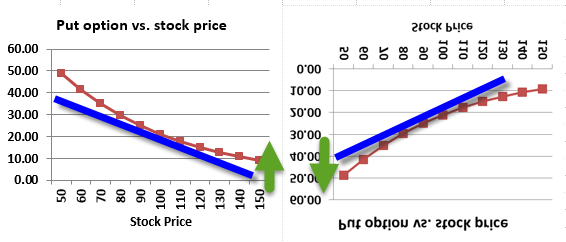
This charts a put option, but it's the same dynamic for a call. On the left is long put, on the right is short put.
  • For the long option, linear approximation (as above and below-left), underestimates the option price and therefore returns a higher VaR (versus actual) under the downside scenario
  • For the short option, linear approximation (below-right) overestimates the option price and therefore returns a lower VaR (versus actual). I hope that helps!
0313_short_option_delta_VaR_2.png
 

Tipo

Member
Subscriber
Sorry about this, so far I understand the part as to how linear approx method understates/over the option price.
However I cant see the relationship as to how understating/overstating an option price will affect the VAR. What links them together?
 

David Harper CFA FRM

David Harper CFA FRM
Subscriber
Hi @Tipo

As this is an ATM option, imagine a dot at S = 100 where the call price is about $13 (and the put price is about $20; the options are not the same). VaR is a maximum potential loss (at a certain confidence) so it's an estimate of the change in price, in the case of the call, when S decreases by some about (i.e., moving to left on the call option chart). For example, for the ATM call option illustrated above, it appears that if the stock price were to drop from 100 to 83 or so (hitting the X axis), the option price would drop to a little under $3.00; however, a linear approximation (blue line) would predict a lower option price (greater loss). VaR is an estimate of the option's price change under the adverse scenario. I hope that helps,
 
Top