Explanation of Vasicek Model??

Shazam023

New Member
i just gone through Vasicek model for "Worst Case Default Rate"
and the formula says:-
T6.311.2Q.png

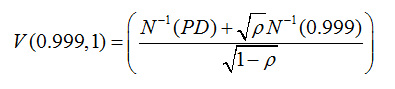
in most of the cases X= 99.1% and N= 1 year.
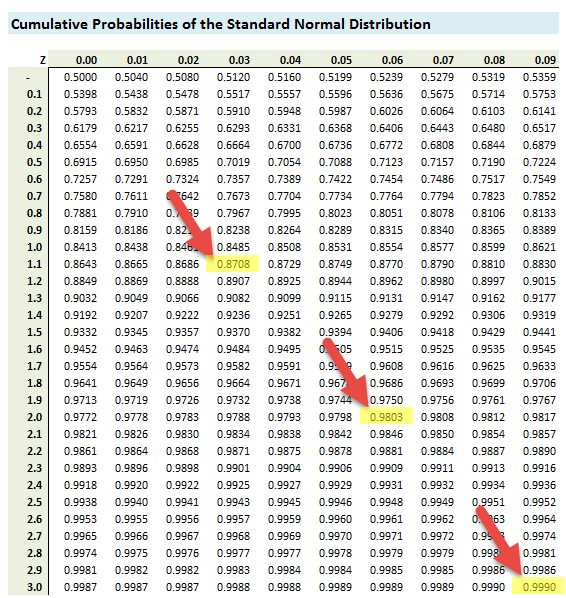
the issue is i'm not able to get the of N^-1 ?? how to solve this??
Ques:
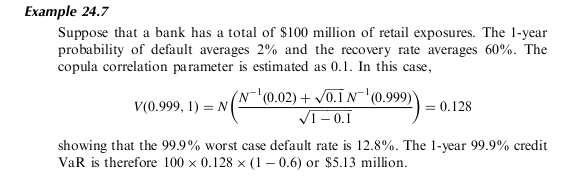
Suppose that a bank has a total of $100 million of retail exposures of varying sizes with each exposure being small in relation to
the total exposure. The one-year probability of default for each loan is 2% and the loss given default for each loan is 40%. The
copula correlation parameter, is estimated as 0.1.
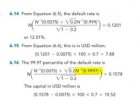
Answer: WCDR (0.999,1)= 0.128
i'm not getting this 0128
please help
 

David Harper CFA FRM

David Harper CFA FRM
Subscriber
Hi @Shazam023 This is Hull's example 24.7 (see below). Please note the outer N(.) which is missing from your function. I just used excel and did get his worst case default (WCD) rate of 12.8% with:

=NORM.S.DIST((NORM.S.INV(pd)+SQRT(rho)*NORM.S.INV(0.999))/SQRT(1-rho),TRUE) = 12.8237%

N^-1 is the inverse of the standard normal CDF; ie, N^-1(2%) = norm.s.inv(2%)
N(.) is the standard normal CDF; ie, in this formula N(-1.13476) = 12.8%
As inverses N(N^-1[probability]) = probability, and N^1(N[quantile]) = quantile. For example, if prob = 2%, then N(N^-1[2%]) = 2%. I hope that helps,

0925-vasicek.png
 
Last edited:

Shazam023

New Member
Hi @David Harper CFA FRM CIPM
Thnkx for reply.
But I still hv few doubts.
Like u said N^-1(2%)= 2. So as per that what I'm getting on solving this is
N[(.02+ .3159)/.94868] = .3541
As N= 1 so it won't matter in multiplication.
Which is no where near the .128
And how do I use Normal Distribution table here? Coz excel is not allowed
 

David Harper CFA FRM

David Harper CFA FRM
Subscriber
Hi @Shazam023

N^-1(2%) = norm.s.inv(2%) = -2.0537 and N^1 = norm.s.inv(99.9%) = 3.092, so we have the following ration inside the outer N(.):
[-2.0537 + sqrt(1-0.10)*3.092]/sqrt(1 - 0.1) = -1.0765/0.9487 = -1.1348.
Then we have N(-1.1348) = norm.s.dist(-1.1348) = 0.1282

Although for a problem like this, you would likely be provided the N^1(.), it is still useful to understand how they can be retrieved. Using a table that only shows the right-hand side of the standard normal Z-lookup (see red arrows):
  • N^-1(0.02) ~= -2.06 because 0.9803 which is nearest to 0.9800 is found at Z = 2.06; if Pr(Z<2.06) = 98%, then P(Z<-2.06) = 1 - 98% = 2%.
  • N^1(0.999) ~= 3.09
  • N(-1.13) ~= 12.92% = 1 - 0.8708. Although if we used lookups for the inside ratio, we would have computed -1.14, such that N(-1.14) ~= 12.71% = 1 - 0.8729; i.e., the lookup will get us only an approximation but it's still pretty close. I hope that helps!
0929-z-table.png
 
Last edited:

Shazam023

New Member
@David Harper CFA FRM CIPM
Thnkx a lot.
So basically if;
• N^-1(x) => 1-x and thn calculate probability.
• N^1(-x) => directly lookup for probability.
• N(-x) => lookup for (x) thn 1-probability.
No more confusion. Gonna bookmark this page for future reference.
Thnkx once again.
 

David Harper CFA FRM

David Harper CFA FRM
Subscriber
Hi @Shazam023 I had a little typo, I meant: N^1(0.999) ~= 3.09. But you should be able to see why. I'm not sure memorizing is helpful, I think it's much more effective to understand the lookup table; specifically, that this lookup table gives us the cumulative probabilities for quantiles (Z = ?) in the right-hand side of the distribution. Once that is understood, variations can be handled. Thanks!
 

afterworkguinness

Active Member
That's an interesting question. I would hazard an educated guess that you would use a default probability for the term you are looking for. So for worst case default over 2 years you would use the 2 year PD as an input. I don't think you can simply scale the 1 year. But this is just a guess.
 

David Harper CFA FRM

David Harper CFA FRM
Subscriber
Hi @Tania Pereira As rho --> 1.0, WCDR --> 100% (in the limit, as the fraction divides by zero, for exactly rho = 0, the formula evaluates to #DIV/0!, but for example rho = 0.999 produces WCDR ~= 1.00). For the IRB function, Basel bounds rho (ie, asset correlation) to [0.12, 0.24]. Thanks,
 

Oxana C

New Member
Subscriber
Hi @Shazam023

N^-1(2%) = norm.s.inv(2%) = -2.0537 and N^1 = norm.s.inv(99.9%) = 3.092, so we have the following ration inside the outer N(.):
[-2.0537 + sqrt(1-0.10)*3.092]/sqrt(1 - 0.1) = -1.0765/0.9487 = -1.1348.
Then we have N(-1.1348) = norm.s.dist(-1.1348) = 0.1282

Although for a problem like this, you would likely be provided the N^1(.), it is still useful to understand how they can be retrieved. Using a table that only shows the right-hand side of the standard normal Z-lookup (see red arrows):
  • N^-1(0.02) ~= -2.06 because 0.9803 which is nearest to 0.9800 is found at Z = 2.06; if Pr(Z<2.06) = 98%, then P(Z<-2.06) = 1 - 98% = 2%.
  • N^1(0.999) ~= 3.09
  • N(-1.13) ~= 12.92% = 1 - 0.8708. Although if we used lookups for the inside ratio, we would have computed -1.14, such that N(-1.14) ~= 12.71% = 1 - 0.8729; i.e., the lookup will get us only an approximation but it's still pretty close. I hope that helps!
0929-z-table.png
Hi David, could you please help in understanding how can we find N^1(0.999) or N^1(0.9997) from z table like the one given during the FRM exam? (its format is slightly different from the above) Thanks
 

David Harper CFA FRM

David Harper CFA FRM
Subscriber
Hi @oxanag I think there are two aspects to this. The first is the normal distribution's symmetry that you must know for the exam. The second will be GARP's responsibility. See snapshot below, from GARP's P1 practice paper. GARP lately has only been providing the left size of the distribution.
  • The normal is symmetric: we definitely need to know that N^-1(Z) = -N^-1(1-Z). For example, N^-1(0.99) = -N^-1(1 - 0.99) = -N^-1(0.01) = -(-2.33) = 2.33. Or, using a directly displayed cell below, N^-1(0.9980) = -N^-1(1 - 0.9980) = -N^-1(0.0020) = -(-2.88) = 2.88. And we will realize it's an approximation to two decimals.
  • This table only goes out to Z(-3) so it doesn't show up more than (1 - 0.0013) = 99.87%. GARP would need to give you more help to get out to higher confidence levels. You should be able to interpolate but we can't really interpolate here beyond the 0.99870 point. I hope that's helpful,
1644261321117.png
 
Last edited:

Oxana C

New Member
Subscriber
Hi @oxanag I think there are two aspects to this. The first is the normal distribution's symmetry that you must know for the exam. The second will be GARP's responsibility. See snapshot below, from GARP's P1 practice paper. GARP lately has only been providing the left size of the distribution.
  • The normal is symmetric: we definitely need to know that N^-1(Z) = -N^-1(1-Z). For example, N^-1(0.99) = -N^-1(1 - 0.99) = -N^-1(0.01) = -(-2.33) = 2.33. Or, using a directly displayed cell below, N^-1(0.9980) = -N^-1(1 - 0.9980) = -N^-1(0.0020) = -(-2.88) = 2.88. And we will realize it's an approximation to two decimals.
  • This table only goes out to Z(-3) so it doesn't show up more than (1 - 0.0013) = 99.87%. GARP would need to give you more help to get out to higher confidence levels. You should be able to interpolate but we can't really interpolate here beyond the 0.99870 point. I hope that's helpful,
View attachment 3572
Thanks David. Yes, I am aware about the need to master normal distribution symmetry concepts which I think I do understand (more or less). I was just trying to understand the below exercise related to Vasicek model from Garp's Valuation and Risk Models book (page 83) and it implies that you need to find the z score value to find N^1(0.9997), which is beyond the (-3) value given in the table. Now I know from excel using function NORM.S.INV that it's 3.43. I just thought I was missing something by not being able to find the corresponding z value in the table.

Thanks a lot for the explanation, it's very helpful and reassuring, and it makes sense now. I just hope GARP will provide further guidance if similar question will be given during the exam.
 

Attachments

  • 1.JPG
    1.JPG
    10.1 KB · Views: 3
Last edited:

yLam4028

Active Member
Sorry I have a stupid question about why the text emphasise higher F = ( higher X ) would result in higher U.
is it because of the relationship - Ui = aF + sqrt(1-corr) * z?

if U = inverse normal of PD and PD soars because a poor economy - lower (F ), the U should increase too! so lower F and higher U

I spent sometime understanding this equation and I think the key is to realise we are basically doing a simple probability lookup ( xi-mean/std) . However the variation is obtained through shifting the mean of the distribution closer/farer to the given PD(xi) instead. I hope I am correct:(
 

gsarm1987

FRM Content Developer
Staff member
Subscriber
@yLam4028 the book says if F is high the economy is doing well (aka low PD) then U will tend to be high (pushed way far into the tail corners). See page 75-77 of the GARP book.

Re: cupolas, it is where you have 2 distributions, you model their correlation, instead of getting tangled in a huge variance-covariance matrix. Thats done by providing a link between the marginal distributions (distribution of one variable) and the joint distribution (distribution of the variables together). The copula is used to measure the dependence of the joint distribution on the marginal distributions and to measure the strength of the correlation between the variables. The result of the copula is a numerical value (called a correlation coefficient) that can be used to identify the degree of correlation between the variables.

You are close when you related it to normal distribution. instead here are two and they are related through a correlation.
 
Last edited:

yLam4028

Active Member
@gsarm1987 Thank you for your kind response!
when F is high my calculation returns a smaller U ( negative ) - and NORMDIST return a smaller PD.
when F is low my calculation returns a larger U ( positive ) and NORMDIST returns a larger PD.

e.g.
correlation = 0.4, PD=1.5%

negative ( low ) F of -3 = ~ 99.9% confidence has a U of -0.27 and that evaluates to 39% PD
for a larger ( high ) F of -1 = ~ 84% confidence has a U of -1.98 = 2.36% PD
 
Top