Chi Square p value

Stuti

Member
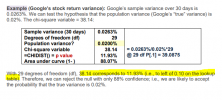
Google’s sample variance over 30 days is 0.0263%. We can test the hypothesis that the

population variance (Google’s “true” variance) is 0.02%. The chi-square variable = 38.14:

Sample variance (30 days) 0.0263%

Degrees of freedom (d.f.) 29

Population variance? 0.0200%

Chi-square variable 38.14 = 0.0263%/0.02%*29

=CHIDIST() = p value 11.93% @ 29 d.f., Pr[.1] = 39.0875

Area under curve (1- ) 88.07%


How did we arrive at the value of 11.93? What formula do we use for approximation?
 

BlackSwan

New Member
11.93% is the answer when you enter =CHIDIST(38.14, 29) into excel. If you are asking for the formula excel uses behind that function to produce 11.93 I am not sure, but for the exam you should be able to either use a CHIDIST() function on your calculator or use the chi-squared distribution table which should be provided if needed.

For the table, you first find the DF on the left column, and follow across that row until you find the first value that's bigger than your calculated chi-square value. The corresponding p-value at the top of that column and the p-value to the left of that gives you your approximated range of your p-value.

If your range for your pvalue is .05-.01 and you're testing your hypothesis at a 5% significance level you could confidently reject the null hypothesis.
If your range for your pvalue is .1-.05 and you're testing @5% significance level you could not confidently reject the null hypothesis
 

Stuti

Member
yup i got the value when using the excel function and was using some online calculators...however while computing the p value have always used extrapolation..hence was inquisitive abt the exact way...guess i am missing something while computing that...Thanks!
 

haziqmn

New Member
Hye there, sorry I am still new to the Chi squared distribution calculation. I was looking at the same explanation in the note below and still couldnt figure out how to arrive at 11.93%.
1611801284403.png


I looked up the next larger value than 38.14 in the chi square table below which is 39.087.

1611801284054.png

After this step, I am stuck on how to get the p-value to equal 11.93%. Help please!
 

Attachments

  • 1611801125623.png
    1611801125623.png
    24.9 KB · Views: 3

David Harper CFA FRM

David Harper CFA FRM
Subscriber
Hi @haziqmn Because the p-value is a tail probability, it is an inverse distribution function and, as such, requires an (Excel or other) function call. It is analogous to, using the more familiar normal distribution being given the quantile (aka, deviate) of 2.33 and retrieving the probability of 1.0% by using =1 - NORM.S.DIST(2.33, true = cdf) = 1.0%. You actually already did the hard part! You noticed that 39.09 corresponds to 10.0% probability. See my version of the same table below. My lookup table, like all lookup tables, is using the inverse function, in this case =CHISQ.INV.RT(x, df) to return the quantile given the probability; so it's the inverse of returning the probability (e.g., 10.0%) given the quantile (e.g., 39.09). But the headers on the table are effectively p-values! So, without Excel, what can we infer? We can see that 38.14 lies in between 33.71 and 39.09 and therefore the p-value must be higher than 10.0% because it must be between 25.0% and 10.0%. At this point we can interpolate: (38.14 - 33.71)/(39.09 - 33.71) * (10.0% - 25.0%) + 25.0% = 12.64%. Not a terrible linearly interpolated approximation of the correct 11.93%. I hope that's helpful!

012821-chi2-lookup.jpg
 

haziqmn

New Member
Hi @haziqmn Because the p-value is a tail probability, it is an inverse distribution function and, as such, requires an (Excel or other) function call. It is analogous to, using the more familiar normal distribution being given the quantile (aka, deviate) of 2.33 and retrieving the probability of 1.0% by using =1 - NORM.S.DIST(2.33, true = cdf) = 1.0%. You actually already did the hard part! You noticed that 39.09 corresponds to 10.0% probability. See my version of the same table below. My lookup table, like all lookup tables, is using the inverse function, in this case =CHISQ.INV.RT(x, df) to return the quantile given the probability; so it's the inverse of returning the probability (e.g., 10.0%) given the quantile (e.g., 39.09). But the headers on the table are effectively p-values! So, without Excel, what can we infer? We can see that 38.14 lies in between 33.71 and 39.09 and therefore the p-value must be higher than 10.0% because it must be between 25.0% and 10.0%. At this point we can interpolate: (38.14 - 33.71)/(39.09 - 33.71) * (10.0% - 25.0%) + 25.0% = 12.64%. Not a terrible linearly interpolated approximation of the correct 11.93%. I hope that's helpful!

012821-chi2-lookup.jpg
Thank you David for the clarification! :D
 

JLim3856

New Member
Subscriber
Hi @David Harper CFA FRM ,

Could you please clarify during the FRM exam, how would we be expected to calculate the p value? Like haziqmn, I was able to look up the next larger value than 38.14 in the chi square table which is 39.087. Afterwards, I am stuck on how to get the p-value of 11.93%.

Are we supposed to use estimation as per what you did above? Or are we able to calculate the exact p value using calculators? (I am using BA II Plus).

Additional question: Would the tables Chi-squared, F, T-distribution table etc be provided for candidates during the exam?


David Harper CFA FRM

David Harper CFA FRM
Subscriber
Hi @JLim3856 In the exam, you will not be required to "calculate" the p-value (beyond scope of a calculator). At most, you may need to interpret it or refer to an obvious p-value per header in a lookup table snippet (the exam provides a Z lookup which--I think you understand--implicitly has selected p-values like 1% and 5% in the header labels). So, do not worry about calculation of the p-value. Probably do not even worry about interpolating to find the p-value (more likely would be a direct question about mere interpolation).

These examples are to concretely illustrate the concept of the p-value: you may be asked to interpret it, or to deal with it conceptually/qualitatively.

Re: Would the tables Chi-squared, F, T-distribution table etc be provided for candidates during the exam?
Historically, the exam always provided a Z lookup (i.e., normal distribution) but any other distributional assumptions/table snippets have only been provided within (embedded) in the question, if needed.

I hope that's helpful!
 
Top