Hey everyone,
I found this question in an old item set and wanted to know if anyone could help explain how to bootstrap the curve in excel. I have my workings in an excel file for anyone that’s interested. But I am mostly struggling with questions a and c in this item set:
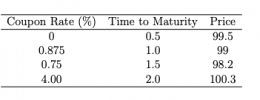
You observe the prices for the following four US Treasury bonds:

Compute the yield curve (i.e., spot rate curve) for maturities from 6months to 2 years (intervals of 6 months).Note:US Treasuries use semiannual compounding, and coupons are paid every six months.
Now assume that, one year later, the zero coupon yield curve is as
follows:

What is the total return (or “holding period return”) over the year on the 2-year coupon bond identified in
I found this question in an old item set and wanted to know if anyone could help explain how to bootstrap the curve in excel. I have my workings in an excel file for anyone that’s interested. But I am mostly struggling with questions a and c in this item set:
You observe the prices for the following four US Treasury bonds:

Compute the yield curve (i.e., spot rate curve) for maturities from 6months to 2 years (intervals of 6 months).Note:US Treasuries use semiannual compounding, and coupons are paid every six months.
Now assume that, one year later, the zero coupon yield curve is as
follows:

What is the total return (or “holding period return”) over the year on the 2-year coupon bond identified in
