Where is the efficient frontier when correlation is perfectly negative?

Note: this is inspired by @Jayanthi Sankarans' observation at https://forum.bionicturtle.com/thre...tal-asset-pricing-models-video-tutorial.8166/

Let's assume:
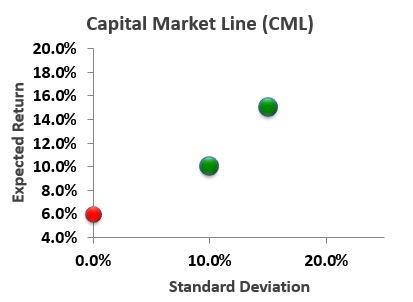
  • Risk-free asset rate is 6.0% (red dot)
  • Asset A has expected return and standard deviation of 10% (green dot)
  • Asset B has expected return and standard deviation of 15% (second green dot)
  • Their correlation = -1.0; i.e., perfect negative correlation
Question: Does the efficient frontier include the risk-free asset?

1209_cml_negative_rho.png
 

brian.field

Well-Known Member
Subscriber
Isn't the efficient frontier 2 straight line segments connecting the greens to the red in the case of perfect negative correlation? So, yes, it would include the risk free asset.
 

ShaktiRathore

Well-Known Member
Subscriber
Hi
At 0% std deviation the eff. Frontier intersects at 12%.
0=10w-15(1-w)=>25w=15=>w=.6 in A.
Exp return at 0 std dev.=.6(10)+.4(15)=12% which lies above risk free asset.so efficrient frotier does not seems to include riskfree asset. Brian efficient frontier is i think 2 straight lines joining green points to point (0,12%) on exp return axis.
Thanks
 
Last edited:

Dr. Jayanthi Sankaran

Well-Known Member
Hi Shakti,

Yes, when 40% is invested in B (60% in A), the Expected return of the portfolio is 12% with a standard deviation of 0%. So, the efficient frontier does not include the risk-free asset with 6% return. Thanks!
 

David Harper CFA FRM

David Harper CFA FRM
Subscriber
Thanks for your responses! @Jayanthi Sankaran I posted it here because I was (I am) less than certain myself ;) I've assumed (taught, been taught) that the CML is the line which mixes two components: the market portfolio (i.e., the mix of risky-only assets with the highest Sharpe ratio) and the risk-free asset. Therefore, my initial answer (to myself) was exactly what @brianhfield wrote above. But this does not appear to work in this scenario, at all. For one thing, if we assume the risk-free asset has return of 6.0%, the "Market porfolio" here is near to the minimum variance portfolio (i.e., optimal Sharpe = 7.74 where Exp return = 12.2% and standard deviation = 0.8%).
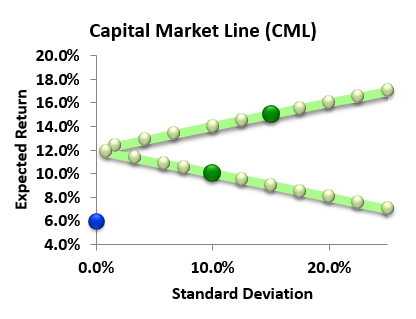
Visually, it would appear that the efficient frontier is the upper green line segment which excludes the risk-free rate. To be honest, as I have not actually considered this scenario in depth, I am not totally confident where I would draw the CML; i.e., If I draw the line connecting Risk free asset to the Market Portfolio, this line contains inefficient portfolios (?). Another possibility is to conclude the Risk-free asset (at return = 6%) is logically inefficient and therefore should be replaced by the actual y-intercept (and this is consistent, I think, with the zero beta CAPM model). It's interesting ...
121014_camp_perfect_negative_corr.png
 
Last edited:

ShaktiRathore

Well-Known Member
Subscriber
Hi,
David if you consider just the efficient portfolios then the upper green line is the cml as per zero beta capm as u cited. Now if i draw tangent to the green curve(portfolio with max sharpe ratiois what investors choose as per Cml theory) from risk free asset its undefined goes to infinity to get sharpe ratio infinity which is not practical.so cml which is set of most efficient portfolios is the upper green line possible since invluding risk free asset is just making sharpe ratio undefined. So we should opt for more efficient 12% portfolo then rf.
Therefore zero beta capm seems more appropriate here than the usual rf capm model.
Thanks
 
Last edited:

Dr. Jayanthi Sankaran

Well-Known Member
Hi David,

The minimum variance portfolio (rho = -1) is the one with the expected return of 12% and standard deviation = 0%. When a line is drawn from Rf = 6% through Asset B with Rb = 15%, it is completely dominated by the efficient frontier (upper green segment). However, after B, the traditional CML joining Rf with B, takes over - and goes to infinity! So, the efficient frontier (CML) is the upper green segment and does not include the riskless asset. As you rightly pointed out, this is consistent with a zero-beta portfolio....

However, how do you get the optimal Sharpe = 7.74, Exp return = 12.2% and standard deviation = 0.8%?

Thanks!
 

David Harper CFA FRM

David Harper CFA FRM
Subscriber
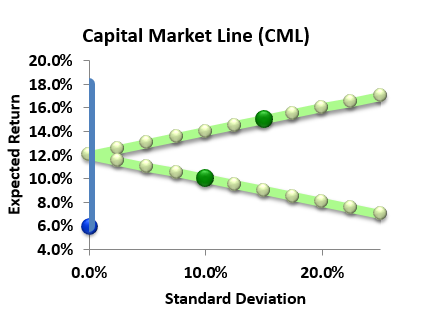
Hi @Jayanthi Sankaran That optimal Sharpe was a mistake, sorry (I was reading it from our CAPM XLS based on the inputs, but it was not accurate given this extreme inputs ....). As @ShaktiRathore points out (and you reiterate), the optimal Sharpe appears to be on the Y-axis where the standard deviation is zero (My XLS has the Sharpe as 45.555 million due to the essentially zero volatility!). Then under the ordinary procedure, the CML connects the risk-free rate to the Market Portfolio (i.e., the optimal Sharpe ratio where return = 12% and volatility = zero). Exactly as Shakti says, that implies a vertical CML (the vertical blue line below). For example, by borrowing 100% of the risk-free asset and investing 200% (leverage), you can earn: -100%*6% + 200%*12% = 18% with zero volatility. So, you could leverage the up the return vertically. Even this 18% return based on 100/200 short/long is superior to any of the displayed risky portfolios, so it's all just seeming like an absurd scenario.


1211_capm_perfect_neg.png
 
Top