Blog Week in Financial Education (2021-06-14)

David Harper CFA FRM

David Harper CFA FRM
Subscriber
Welcome to another WIFE. Last week we added a new practice question (PQ) set for the Insurance chapter (P1.FMP-2) and a new PQ set for the Risk Monitoring chapter (P2.IM-7). Trying to be realistic, for the mortality table, I pulled actual projected 2021 period life tables from the Social Security administration at https://www.ssa.gov/. We received some truly thought-provoking questions last week. e.g. why would you use a stop-limit? Is put-call parity related to BSM? Thank you especially to @lushukai for a lengthy, valuable response and to @bollengc for identifying several errors and typos. Very much appreciated!

New Practice Question (PQ) sets
In the forum
Curated links
 
Last edited:

David Harper CFA FRM

David Harper CFA FRM
Subscriber
A Note about Delta-Gamma Value at Risk (VaR) as Taylor Series

Alberto asked a good question here about using the delta-gamma formula to estimate the VaR of an option position. Lu Shu (@lushukai) gave an excellent reply and he itemized the four possible long/short call/put scenarios. This refers to one of the most fundamental quantitative applications in risk finance, which is to say the Taylor Series expansion. It is a pattern that applies to options (delta-gamma), bonds (duration-convexity) and even portfolio VaR (marginal VaR). Why do we do this? Rather then re-price complex positions, we use the first (and second, if needed) partial derivatives to approximate the potential loss given a shock to primitive risk factor(s). Our go-to example would be a vanilla bond. Rather than reprice the bond, we can approximate the price change given an assumption of shock to the yield, where negated dollar duration, ∂P/∂y, is the first derivative with respect to yield. For myself, I am a visual learner and prefer to visualize the slope's tangents (like I did here), but it is not necessary. My only advice--and you can see this coming--is that you try to get underneath (or beyond) mere memorization, especially as it pertains to +/- signs. From a merely memorized perspective, I think Taylor Series can seem daunting, but it's really not.

Position Greeks versus Per-option (aka, Percentage) Greeks

My focus here is to illustrate the four scenarios that Lu Shu itemized, and we will pay particular attention to the distinction between a percentage Greek and a position Greek (borrowing from my previous note here). Let's recap that now. A call option must have a positive percentage (i.e., per option) delta between zero and 1.0; for an ATM call option, we might expect Δ(call) = N(d1) = 0.60. For the associated put option, we can expect Δ(put) = N(d1) - 1 = 0.60 - 1.0 = -0.40. Percentage delta arguably is a slight misnomer given they are unitless, but I am going to maintain this terminology given it already has a history. The percentage (per) option put delta is always negative. The percentage (per) option call delta is always positive. Now let's refer to an option contract for which the size is 100 options. We can be long or short the option contract such that we have four possibilities (and illustrated with our examples) :
  • Long call option contract is long 100 call options; e.g., the position delta = +100 * 0.60 = +60
  • Short call option contract is short 100 call options; e.g., the position delta = -100 * 0.60 = -60
  • Long put option contract is long 100 put options; e.g., the position delta = +100 * -0.40 = -40
  • Short put option contract is short 100 put options; e.g., the position delta = -100 * -0.40 = +40
The final signs (+/-) should be appealing. If we have a positive position delta (which is the case for a long call or short put), our position gains when the underlying risk factor (i.e., the stock price) increases. If we have a negative position delta (which is the case for a short call or a long put), our position loses when the underlying risk factor (i.e., the stock price) increases. Is the percentage/position semantic distinction really vital? No, not really. It's just that a common question from new learners is, put delta was always negative, how can it be positive? And, in reality, we don't need the percentage/position labels because the context will tell us. But, in the meantime, until you are comfortable, I prefer to stress the explicit multiplication wherein the short (long) is represented by negative (positive) quantity as a multiplier.

Delta-Gamma approximation for Long And Short Option Positions

The question pertains to the delta-gamma version (i.e., the version for the option asset class) of the truncated Taylor Series. Where δ is the delta and Γ is the gamma, the approximated price change is given by Δprice = df = δ*ΔS + 0.5*Γ*ΔS^2. In Lu Shu's reply to the question, he itemized the four scenarios ...
"I think to summarize everything so that we can go clearly via principles and spot any errors (from my understanding):
  • Long Call Option → Positive Delta and Positive Gamma → df = (-ΔS)*(+Delta) + 0.5*(+Gamma)*(-ΔS)^2 → VaR Lowered (the delta and gamma terms offset each other and are of opposite signs)
  • Long Put Option → Negative Delta and Positive Gamma → df = (+ΔS)*(-Delta) + 0.5*(+Gamma)*(+ΔS)^2 → VaR Lowered (the delta and gamma terms offset each other and are of opposite signs)
  • Short Call Option → Negative Delta and Negative Gamma → df = (+ΔS)*(-Delta) + 0.5*(-Gamma)*(+ΔS)^2 → VaR Exacerbated (the delta and gamma terms add up and are of similar signs)
  • Short Put Option → Positive Delta and Negative Gamma → df = (-ΔS)*(+Delta) + 0.5*(-Gamma)*(-ΔS)^2 → VaR Exacerbated (the delta and gamma terms add up and are of similar signs)" -- Lu Shu
... and then I illustrated them numerically. See below. My deltas are 0.60 and -0.40, while my gammas are +0.10; that's a bit unrealistically high, for illustrative convenience (otherwise identical calls and puts will have the same gamma, and the percentage gamma is always positive). In yellow, you can see the risk factor assumptions: if we are long calls or short puts, the exposure is to a stock price drop; if we are long puts or short calls, the exposure is to a stock price increase. For simplicity, I assume a $1.00 shock to the risk factor. The delta term is a simple linear approximation; e.g., the short put has per-option delta of -0.40; the short put contract has position delta of -100*-0.40 = +40; and if the stock drops by $1.00, the linear approximated loss on a single short put is $0.40 because the approximated price change is $0.40. The risk factor, ΔS, enters in its natural mathematical form. Under the Taylor Series columns, the gamma term is (positive) +0.05 under all scenarios because the ΔS gets squared, ΔS^2. Due to this, the gamma term always adds to the delta term: for the long call, the -0.60 linear price drop gets mitigated to -0.55; for the long put, the -0.40 linear price drop gets mitigated to -0.35; for the short call , the +0.60 linear price increase (which is a loss to the short position!) gets exacerbated to +0.65; and for the short put, the +0.40 linear price increase (again, a loss to the short position) gets exacerbated to +0.45. I hope that is helpful illustration!

2021-06-14-delta-var-v4.jpg


Additional References[/B]
Hi @Tereza That looks correct (as long as you understand why you are taking the absolute value at the end, which is not a necessary interpretation. Here is previous link which may be helpful https://forum.bionicturtle.com/thre...amma-value-at-risk-var-allen.7203/#post-28378

In this way, the initial (Taylor Series) formula is always the same, by the following appears to be consistent with yours:
  • Options: df = delta*ΔS + 0.5*gamma*ΔS^2 <-- The risk factor is the stock price
    • In the case of a long call or short put option, the risk is a drop in the stock price: -ΔS
      • A long call will have positive delta = [0,1] such that estimated option price change = df = delta*ΔS + 0.5*gamma*ΔS^2 = (+delta)*(-ΔS) + 0.5*(+gamma)*(-ΔS)^2 = negative + positive; i.e., loss due to delta mitigated by gamma
      • A short put will have negative delta = [-1,0] such that estimated option price change = df = delta*ΔS + 0.5*gamma*ΔS^2 = (-delta)*(-ΔS) + 0.5*(+gamma)*(-ΔS)^2 = positive + positive; i.e., this change in option value and the position is short so this is a loss due to delta exacerbated (made worse) by the gamma
    • In the case of a long put or short call option, the risk is an increase in the stock price: +ΔS
      • A long put will have negative delta = [-1,0] such that estimated option price change = df = delta*ΔS + 0.5*gamma*ΔS^2 = (-delta)*(+ΔS) + 0.5*(+gamma)*(+ΔS)^2 = negative + positive; i.e., loss due to delta mitigated by gamma
      • A short call will have positive delta = [0, 1] such that estimated option price change = df = delta*ΔS + 0.5*gamma*ΔS^2 = (+delta)*(+ΔS) + 0.5*(+gamma)*(+ΔS)^2 = positive + positive; i.e., loss due to delta exacerbated by gamma
  • Bonds: dP/P = -D*Δy + 0.5*convexity*Δy^2 <-- risk factor is yield change. Note this is effectively similarto the version above for options!
    • Long bond: risk is increase in yield, +Δy, such that dP/P = -D*Δy + 0.5*convexity*Δy^2 = -D*(+Δy) + 0.5*convexity*(+Δy)^2 = negative + positive; i.e., loss due to duration mitigated by convexity
    • Short bond: risk is drop in yield, -Δy, such that dP/P = -D*Δy + 0.5*convexity*Δy^2 = -D*(-Δy) + 0.5*convexity*(-Δy)^2 = positive + positive; i.e., loss due to duration exacerbated by convexity (short the value increase is a loss)
Here is my previous incorporate for reference (from the link above). I hope this is helpful!

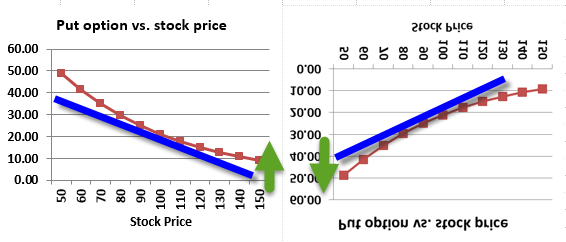
Hi @Anay I quickly created this image to explain. On the left is a long position in a put; on the right (i just flipped it!) is the corresponding short position in a put. In both cases, red is the actual non-linear payoff, while blue represents one of the tangents such that its slope is delta:
0313_short_option_delta_VaR_2.png


I think trying to frame in "add" or "subtract" is too hairy (difficult); e.g., is the VaR positive or negative? Rather, the point is:
  • If we are long the put, the risk is an increase in the stock price: the value predicted by the linear approximation (blue) is less than the actual value. However, we can say this different ways, right? although the actual value (red) is greater than the approximated (blue) value (option price), we can say "the actual loss is less than delta estimates" and, as VaR tends to be expressed in positive terms "the true VaR [i.e., loss expressed as a positive amount] is less than delta estimates" because the gamma (the curvature) works in our favor. This is an illustration of the advantage of being "long gamma," which the first term (delta) does not caputure.
  • On the other hand, the short put (right side) is the opposite. Here the risk is a decrease in the stock price such that the linear approximated value (option price) is greater than the true value. This is being short gamma and it works against us. Now the actual loss is worse than estimated; i.e., the VaR is greater.
In mathy terms, Taylor truncated to only two terms says: df = δf/δS*δS + 0.5*δ^2f/δS^2*dS^2 + ....
In the option context, that is df = ΔS*delta + 0.5*gamma*ΔS^2
  • ΔS*delta is represented by the blue line. Consequently, ΔSinforms df (change in option value) obviously:
    • For a long put position, risk is +ΔS with linear impact: -df = +ΔS*(-delta)
    • For a short put position, risk is -ΔS with linear impact: +df = -ΔS*(-delta)
  • But 0.5*gamma*ΔS^2 is always additive in the Taylor Series because (ΔS^2) is positive regardless of up/down stock price
    • For a long put position, that implies the positive gamma terms mitigates the negative delta term (-df); i.e., reduces risk
    • For a short put position, that implies the positive gamma terms exacerbates the postive delta term (+df); i.e., increases risk
I hope that helps!
 

Attachments

  • 2021-06-14-delta-var-v4.jpg
    2021-06-14-delta-var-v4.jpg
    32.1 KB · Views: 4
Last edited by a moderator:
Top