WCS worst case scenario

ckyeh

New Member
Hi David:

On your webnair: 2010-4[1].a-Valuation, page 18:

The WCS assumes the firm increases its level of investment when gains are realized; i.e., that the firm is “capital efficient.”

I couldn't clearly understand the point.
I excerpt the book PUTTING VaR TO WORK, page 113:

First, our analysis was developed in the context of a specific model
of the firm’s investment behavior; that is, we assumed that the firm,
in order to remain “capital efficient,” increases the level of investment
when gains are realized. There are alternative models of investment
behaviour, which suggest other aspects of the distribution of returns
should be investigated. For example, we might be interested in the
distribution of “bad runs,” corresponding to partial sums of length J
periods for a given horizon of H.

Hope you can help me understand it!

Thanks!
 

David Harper CFA FRM

David Harper CFA FRM
Subscriber
Hi ckyeh,

That is exactly the source that links to the slide (Linda Allen Ch 3). I admit I am not sure what she means; I think maybe she means (eg), if portfolio is $100, and capital tracks VaR/MCS, and say capital is $2.33 (2.33 * $1) and portfolio grows to $110, then capital increases to $2.56 (2.33 * $110). But i never really understood that paragraph ...

... because it comes after a more straightforward point:
"Looking at the results from a different perspective, for the 1 percent, 100-period VaR measure, the VaR is 2.33 while the expected WCS is 2.51 and the first percentile of the WCS distribution is 3.72. If the fraction of capital invested throughout the 100 periods is maintained, then WCS is the appropriate measure in forming risk management policies regarding financial distress. If the firm maintains capital at less than 160 percent of its VaR, there is a 1 percent chance that the firm will face financial distress over the 100 periods."

... as 3.72 (WCS) is ~160% of 2.33 (VaR), all she seems to be saying here is: WCS might be a better metric for [economic] capital buffer.

David
 

evelyn.peng

Active Member
Hi David,
I'm having concrete grasp of the WCS concept. I find your learning spreadsheet to be always helpful to get in depth understanding. I tried to look for how WCS is generated online but unfortunately have not had any luck. If you have done a WCS spreadsheet example before, I would really appreciate taking a look.

Please let me know if my conceptual understanding is correct:

it seems like the WCS is an alternative risk measure to VaR, or Estimated Shortfall. So the options for estimating WCS could also be parametric/analytic methods, historic simulation, Monte Carlos simulation, etc.

Instead of defining the confidence interval as in the case of VaR, would we define the "worst case scenario" as an anchor and then use the models to find where that scenario occurs?

Thank you,
Evelyn
 

Nicole Seaman

Director of CFA & FRM Operations
Staff member
Subscriber
Hi David,
I'm having concrete grasp of the WCS concept. I find your learning spreadsheet to be always helpful to get in depth understanding. I tried to look for how WCS is generated online but unfortunately have not had any luck. If you have done a WCS spreadsheet example before, I would really appreciate taking a look.

Please let me know if my conceptual understanding is correct:

it seems like the WCS is an alternative risk measure to VaR, or Estimated Shortfall. So the options for estimating WCS could also be parametric/analytic methods, historic simulation, Monte Carlos simulation, etc.

Instead of defining the confidence interval as in the case of VaR, would we define the "worst case scenario" as an anchor and then use the models to find where that scenario occurs?

Thank you,
Evelyn
Hello @evelyn.peng

I'm not sure if this will help, but there is a great deal of discussion regarding WCS here in this thread: https://forum.bionicturtle.com/thre...r-versus-worst-case-scenarios-allen-3-3.7209/. David elaborated and provided a spreadsheet here within that thread also: https://forum.bionicturtle.com/thre...orst-case-scenarios-allen-3-3.7209/post-48492.

If that thread does not help, I'm sure David or another member can answer your questions. :)

Nicole
 

evelyn.peng

Active Member
Hello @evelyn.peng

I'm not sure if this will help, but there is a great deal of discussion regarding WCS here in this thread: https://forum.bionicturtle.com/thre...r-versus-worst-case-scenarios-allen-3-3.7209/. David elaborated and provided a spreadsheet here within that thread also: https://forum.bionicturtle.com/thre...orst-case-scenarios-allen-3-3.7209/post-48492.

If that thread does not help, I'm sure David or another member can answer your questions. :)

Nicole
Thanks Nicole for directing me to this post. The spreadsheet contained in this thread is very helpful.
 

David Harper CFA FRM

David Harper CFA FRM
Subscriber
HI @evelyn.peng I do think my previous spreadsheet example is relevant at the link Nicole provided: https://forum.bionicturtle.com/thre...orst-case-scenarios-allen-3-3.7209/post-48492 ie..,
Hi @surbhi.7310 Sure, the key I think to this table is to understand that the worst case scenario (WCS) values are based on an (Monte Carlo) simulation; for example, if we repeated the experiment, while the top two rows (being analytical normal distributions) would remain the same, all of the other numbers would change (aka, sampling variation). So in the case of the one year horizon (H = 250), the simulation is generating a vector of random standard normals, N(0,1), over the next 250 days; in Excel, we can do that with =NORM.S.INV(RAND()). This gives us a future series of random normal quantiles, for example, i literally just did five: -0.374630897, 0.110120593, 2.576642803, 0.666955274, 0.010827841. These have expected mean of zero and variance of about 1.0.

The simulation is a giant matrix of these random standard normal values. It has (apparently) 10,000 columns and (H) rows, where (H) is the horizon (or vice-versa, if you like. I guess it can be H columns, but in my code work typically the rows are the days/dates). So in the case of H = 250, each column (of 250 days) has a single worst loss day. Imagine pulling this "worst day" out to the bottom (instead of a sum or average). We have a entire row of 10,000 of these worst days, which itself is a distribution! The mean of this sample is the "Expected WCS" but this distribution also has its own quantiles; e.g., 1% of this row is below -3.92, or put another way, among these 10,000 worst days (each the worst day among a column of 250 simulated days), 100 were less than -3.92. Hopefully, it is intuitive that the "Expected WCS" of this 250 * 10,000 matrix is less than the -2.33 in the analytical normal (or more than 2.33, if you will).

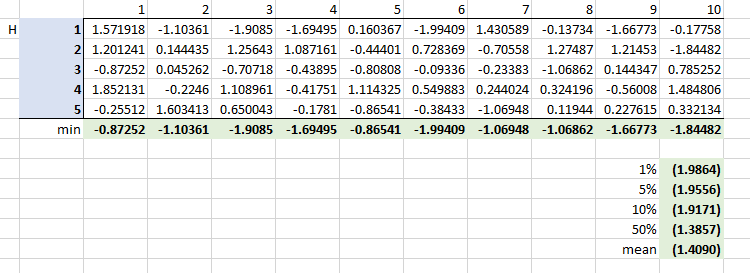
However, if the horizon is only 5 days (H = 5), that is a (very) small sample. And here I will literally use Excel to generate 10 of these, here is my very first try (here is my very quick XLS at https://www.dropbox.com/s/k8ermku0offcooe/0303-wcs.xlsx?dl=0):
0303-wcs.png

See how with sample H only 5, the WCS doesn't tend to be extreme? And, notice, in mine the 1% of the WCS distribution is only -1.98 (compared to the analytical - 2.33). If you have Excel, maybe you can open it and, in my experience, it is just so much easier to comprehend this by playing with it for a bit. I hope that gives some color to Allen's exhibit!

... the FRM has never taken a deep dive on worst case scenario (it has only every appeared in the Linda Allen, to my knowledge). On the surface it has a simple definition:
"In this section a complementary measure to VaR is offered which is related to stress testing. It is the “worst-case scenario” (WCS) measure. WCS asks the following question “What is the worst that can happen to the value of the firm’s trading portfolio over a given period (e.g., the next 20 or 100 trading days)?” This is to be compared with VaR’s focus on the 5th or 1st percentile of the distribution.

To understand why WCS may be a more appropriate risk measure than VaR, consider the example above, where the firm’s portfolio return is normally distributed with a mean µp and volatility σp. VaR tells us that losses greater than µp – 2.33σp will occur, on average, once over the next 100 trading periods, and that losses greater than µp – 1.65σp will occur, on average, once over the next 20 trading periods. From a risk management perspective, however, managers care more about the magnitude of losses given that a large loss occurs (WCS), rather than the number of times they should expect to face a loss of a given amount or greater (VaR)."

From this definition, in my view:
  • If the approach is historical simulation (i.e., historical window of returns/values), the WCS is simply the worst outcome in the window
  • If the approach is Monte Carlo simulation, similarly the WCS is simply the worst generated outcome
  • If the approach is parametric (aka, analytical), either the distribution is discrete or continuous:
    • If the distribution is discrete and bounded, the WCS is simply the worst outcome
    • If the distribution is continuous or unbounded (e.g., the normal distribution has tails that theoretically extend infinitely), then we cannot easily identify an obvious WCS and I think we need to simulate. A good procedure in this case is to simulate, per my worksheet example, some number of random draws (e.g., n = 100 or n = 1000) and simply select the worst outcome in the sample! I hope that's helpful,
 

evelyn.peng

Active Member
HI @evelyn.peng I do think my previous spreadsheet example is relevant at the link Nicole provided: https://forum.bionicturtle.com/thre...orst-case-scenarios-allen-3-3.7209/post-48492 ie..,


... the FRM has never taken a deep dive on worst case scenario (it has only every appeared in the Linda Allen, to my knowledge). On the surface it has a simple definition:


From this definition, in my view:
  • If the approach is historical simulation (i.e., historical window of returns/values), the WCS is simply the worst outcome in the window
  • If the approach is Monte Carlo simulation, similarly the WCS is simply the worst generated outcome
  • If the approach is parametric (aka, analytical), either the distribution is discrete or continuous:
    • If the distribution is discrete and bounded, the WCS is simply the worst outcome
    • If the distribution is continuous or unbounded (e.g., the normal distribution has tails that theoretically extend infinitely), then we cannot easily identify an obvious WCS and I think we need to simulate. A good procedure in this case is to simulate, per my worksheet example, some number of random draws (e.g., n = 100 or n = 1000) and simply select the worst outcome in the sample! I hope that's helpful,
Thanks David. This helps me IRL as this question was posed to me by a superior. i.e., can you look into reporting the "worst case scenario" instead of VaR based risk metric. I am very relieved that you confirmed my (rudimentary) understanding of this concept!
 

David Harper CFA FRM

David Harper CFA FRM
Subscriber
Hi @evelyn.peng oh, cool, always excited to be helpful IRL. You know, the more I think about it, if I were going to do this I would be tempted to sample (aka, bootstrap) any distribution, even a parametric and especially a historical dataset. Basically, Dowd's (Chapter 4) "bootstrap historical simulation" except the goal is to retrieve the worst outcome (rather than the VaR quantile). So then it's a question of how large is the sample matrix. Don't quote me exactly--thinking out loud here--on this next step (I may code it up because I'm keen on the concept), but I am thinking the approach could be something like:
  • Assume N = 100 (or whatever) is the sample size, and
  • Let T = the number of samples, say T = 1,000. So we generate a matrix of 100 columns by 1,000 rows; i.e., 1,000 samples of the sample
  • Each row has a single worst outcome; i.e., the worst outcome in the sample. That's a column-vector of worst outcomes
  • Sort the vector and retrieve the worst outcome based on confidence level
    • The 999th worst might be called the "WCS with 99.9% confidence" (ie, 1/1000), or
    • The 949th worst might be called the "WCS with 95.0% confidence" I hope that's interesting!
 

evelyn.peng

Active Member
Hi @evelyn.peng oh, cool, always excited to be helpful IRL. You know, the more I think about it, if I were going to do this I would be tempted to sample (aka, bootstrap) any distribution, even a parametric and especially a historical dataset. Basically, Dowd's (Chapter 4) "bootstrap historical simulation" except the goal is to retrieve the worst outcome (rather than the VaR quantile). So then it's a question of how large is the sample matrix. Don't quote me exactly--thinking out loud here--on this next step (I may code it up because I'm keen on the concept), but I am thinking the approach could be something like:
  • Assume N = 100 (or whatever) is the sample size, and
  • Let T = the number of samples, say T = 1,000. So we generate a matrix of 100 columns by 1,000 rows; i.e., 1,000 samples of the sample
  • Each row has a single worst outcome; i.e., the worst outcome in the sample. That's a column-vector of worst outcomes
  • Sort the vector and retrieve the worst outcome based on confidence level
    • The 999th worst might be called the "WCS with 99.9% confidence" (ie, 1/1000), or
    • The 949th worst might be called the "WCS with 95.0% confidence" I hope that's interesting!
Indeed. Thank you David. If you code it, it would be interesting to see a snippet of the result.
 
Top