Hi David/Nicole, I thought that Only Volatility Frown would result by jumps in the underlying asset price, but the answer to 20.3 states otherwise.. Kindly confirm ?
The effect of jumps in the asset prices tends to evens out in the longer term therefore there is less effect on the volatility of the underlying asset . For shorter period the effect of jumps is more and as the time of maturity increases the overall effect of the jumps tends to becomes smaller and smaller. For e.g. for 3 months period the jumps are +30%,+20%,-10% (total=40%/3=13.3%) while for longer period +30%,+20%,-10%,+5%,-10%,10%(total=45%/6=7.5%).I think this is closely related to the concept of mean reversion. The volatility smile is caused by these jumps effect which is more pronounced in case of smaller time period option as compared to the longer tie period option.
Hi David/Nicole, I'm having the exact same issue with this question's answer. I thought that a jump would result in a frown but the answer says otherwise. can you please advise?
Many thanks,
Indre
Hi sassing, good point. The study note should be revised because it is trying to capture (summarize) two separate points by Hull (it is unclear which the AIMs means to refer to) :
Section 19.8 (When a Single Large Jump is Anticipated): the single large jump is illustrated with "true distribution is bimodal." Based on a binomial pricing model, Hull then shows that "a single large jump [i.e., $50 either up to 58 or down to 42]" produces a bimodal distribution and the prices imply an implied volatility frown or "inverted smile" (lower implied vol left/right, higher implied vol in the middle)
The this question, from Hull, appears to make a different point about multiple "jumps" versus a single binomial, where the jumps create fat tails. However, I don't see it explicitly sourced in the reading. (except for the reference that jumps imply a mixture-of-lognormals, which itself would imply heavy tails, as mixtures tend to imply heavy tails). But it's a little unclear how the question above is explicitly sourced. I hope that helps,
But I think maybe I just figured out the difference only because I thought to look in McDonald. Here is the difference, I think (I will be interested to see if it convinces @Karim_B ?)
Hull's Chapter section "When a Single Jump is Anticipated" (20.8) is the source for asserting that jump(s) imply volatility frown. However, I can now see plainly something that only semi-consciously registered for me previously: his example in 20.8 concerns a single binomial jump (hence the "Single" in the title). It's a stock that jumps from 50 either up to 58 or down to 42. In this comparison, it's like comparing a binomial to a lognormal; I believe that binomial distributions with p near 50% are always light-tailed (converging on kurtosis = 3 as n increases), but a lognormal is always heavy-tailed. So, the single jump implies a binomial with light tails
But the question above (20.3) is referring to a more dynamic, less simple jump pattern, consistent with McDonald (see below, emphasis mine). I hope that's helpful!
Jump Risk and Implied Volatility: In Chapter 21 we presented Merton’s valuation formula for an option when the underlying asset can jump. In this section we see how the jump model can account for the implied volatility patterns like those in Figure 24.1.
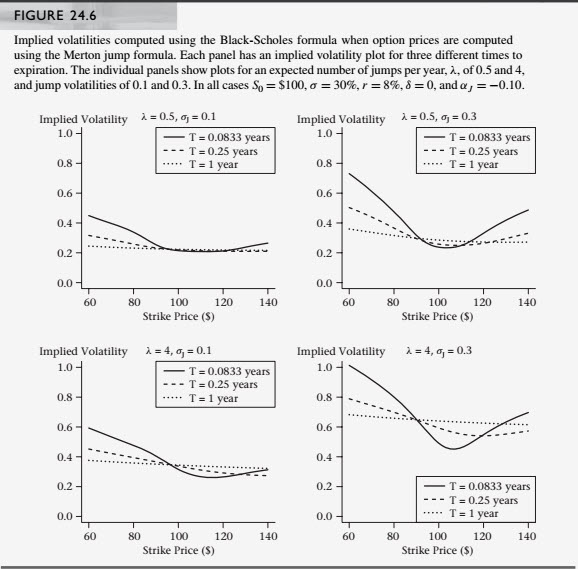
The Merton jump model assumes that stock prices have a different distribution than that assumed by the Black-Scholes model. If prices in the real world were generated by the Merton jump model, and if we then used the Merton jump model to compute implied volatilities, we would find that all options had the same implied volatility. In real life, however, we don’t know exactly what distribution generated the observed option prices. Black-Scholes implied volatilities are a way to interpret observed prices, telling us how the distribution implied by option prices differs from the lognormal model in the Black-Scholes formula. Figure 24.6 [see below] shows Black-Scholes implied volatilities for option prices computed using Merton’s jump formula. All of the plots assume that the diffusive standard deviation is σ = 20% and the mean jump is α(j) = −10%. The jump intensity, λ, and jump volatility, σ(j) , vary across the panels.
As in Figure 24.1, the short-term options in Figure 24.6 have a more pronounced smile than long-term options. In general, smiles are more pronounced when the jump volatility is greater because the chance is greater of a large stock price change that will move an out-of-the-money option into the money. A larger volatility increase is required for out-of-the-money options to account for the resulting option price increase. In addition to affecting the amount of the smile, jumps also increase the level of implied volatilities. AsλandσJ increase, the total effective stock price volatility increases, which results in a higher implied volatility (for example, the curves in the bottom right panel are higher than curves in other panels). For options with 1 year to maturity, there is more a smirk than a smile. Jumps raise overall volatility, but induce less of a smile for longer-term options. The calculations here illustrate how a non lognormally distributed underlying asset can give rise to implied volatility patterns similar to those observed in markets. It is important to keep in mind that the Merton model assumes that jumps are diversifiable, hence there is no risk premium associated with jumps. Also, non jump volatility is constant. We have seen that volatility changes over time, and the empirical evidence (which we discuss below) is that there are risk premia associated with both volatility and jumps." -- McDonald, Robert L.. Derivatives Markets (3rd Edition) (Pearson Series in Finance) (Page 737). Pearson HE, Inc.. Kindle Edition.
Sorry for the delay but work has gotten crazy again at exactly the wrong time as exam day approaches (5:32am my time and going to bed now after working ).
Thanks
Karim
This site uses cookies to help personalise content, tailor your experience and to keep you logged in if you register.
By continuing to use this site, you are consenting to our use of cookies.

")
 ).
).