Hi all,
Seek your kind assistance on this matter. I do not understand the attached 2 files at all.
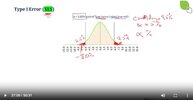
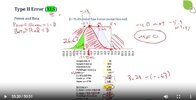
I dont know why left side is shaded green and location of beta are some of the things I do not know.
Thank you in advance,
BX
Seek your kind assistance on this matter. I do not understand the attached 2 files at all.
I dont know why left side is shaded green and location of beta are some of the things I do not know.
Thank you in advance,
BX