struggling with concept of displacement on P1.T2. Chapter 10 - stationary time series

GavinInsight

New Member
As title suggests , i am seeing many references to displacement in notes but am struggling to understand it in the context of the chapter. I think it has to do with the difference in the observed value today (t) vs the observed value x number of days ago (T-x). Is that right? I couldn't find this explained elsewhere in the forums
 

David Harper CFA FRM

David Harper CFA FRM
Subscriber
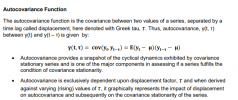
Hi @GavinInsight See below from our notes (page 5), although maybe we could do a better job introducing displacement, as it is a key ingredient in time series (I don't see where GARP's source even introduces it, rather preferring to make the introduction implicit via the lag operator.). To me, displacement is synonymous with their lag. As you can see, we denote displacement with Greek tau (τ), following the previously assigned Diebold, where GARP's current note defines it with 'h'.

As a time series is just a series of time-ordered variables, on such a (geometric) line, displacement is distance. The key idea is that absolute time does not matter, only relative time. So if the periods are days, "lag 1" is "displacement of 1 day", and "lag 2" is "displacement of 2 days", etc. And covariance stationary requires the lag/displacement {1, 2, 3, ... h} autocovariances to be constant. Let's take 2-day displacement; i.e., τ = h = 2. This requires today's cov[y(t), y(t-2)] to equal yesterday's lag-2 cov[y(t-1), y(t- 3)] to equal tomorrow's lag-2 cov[y(t+1), y(t-1)]. Three difference covariance, but all are refer to 2-day displacements. If the covariance structure is stable, we can discard the reference to an absolute point-in-time, t, and refer simply to the displacement y(τ) or y(h). This is a displacement or lag of {1, 2, 3 ... etc} days. But really it's a vector. We can shift from thinking of the timeline as a series of days to a vector of displacements: the ACF and PACF do not have actual (absolute) days on the X-axis, the ACF/PACF plots covariances against an index (X-axis) of displacements. As "auto" implies time series, we can thusly think of (or at least I think of) an ACF/PACF as a plot of an "autocovariance displacement vector".

BT Note:
1646756862889.png

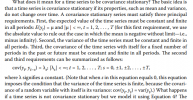
I was curious how CFA approaches this (source: Time-Series Analysis by Richard A. DeFusco, PhD, CFA, Dennis W. McLeavey, DBA, CFA et al, 2022 Refresher Reading, L II, Reading 3, CFA Institute)

1646758706609.png

... so to me the CFA's presentation here is rigorously elegant. Displacement is here denoted by s, and you can see that displacement is a vector per s = 0, +/- 1, +/-2, etc .... I think it's my new favorite statement of the third covariance stationary requirement. I hope that's helpful!
 
Last edited:
Top