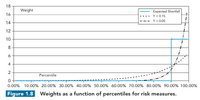
In P1. T4.Chp1 section on Weighting and Spectral risk measures I do not follow the intuition behind this section at all. I understand the point where out of the two investments A and B that B would have a larger expected shortfall since the losses of B can be 10 times the VaR level even when the VaR level is the same for both portfilios. The matter following this point stumps me.
Question 1
"Expected shortfall assigned a probability based weight to all loss levels greater than VaR"
Consider the insurance contract example from the previous section, from one VaR confidence level two probabilities are shown i.e. 0.0064% and 0.9936% for ES calculation for the combined contracts.
1. Are these probabilities what is refered to as "probability based weight"?
Question 2
"If and only if the weights are a non decreasing function of the percentile of the loss distribution"
If I take the insurance contract example again from the previous section the probability based weight based on a 99% confidence percentile is 99.9936% - 99% = 0.9936% for the 21 mn loss but if we switch to a 99.5% confidence then the probability based weight drops to 99.9936% - 99.5% = 0.4946%.
1. Is this what is mean by weights being a function of the percentile?
2. How can you achieve a non decreasing weight?
Question 3
The figure 1.8 shows the weight for the expected shortfall measure at 10. How is this value computed?

