You are using an out of date browser. It may not display this or other websites correctly.
You should upgrade or use an alternative browser.
You should upgrade or use an alternative browser.
R25.P1.T4.ALLEN_Ch 2& 3:Topic:TAYLOR_SERIES_APPROXIMATIONS
- Thread starter gargi.adhikari
- Start date
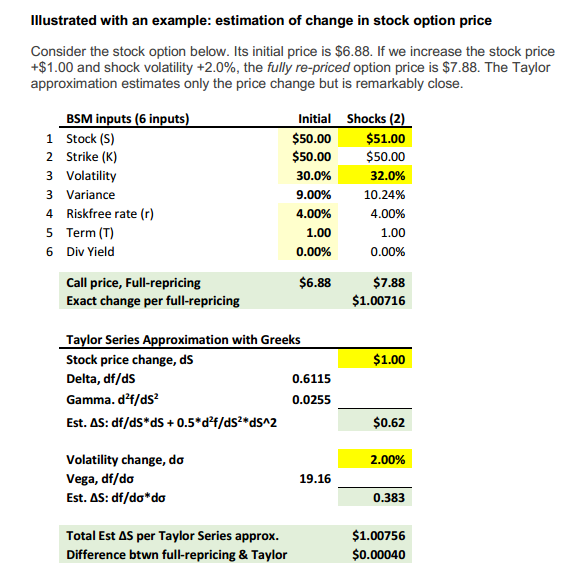
Hi @gargi.adhikari Good question, as usual.  Please note that we have since issued a (greatly) improved version of this Study Note, please see https://learn.bionicturtle.com/topic/study-notes-allen-chapters-2-3/ e..g, the table above has been replaced by (I hope you will agree!) the more readable display below (please note that I have not yet quite published the corresponding learning spreadsheet, there are a few more edits I still want to make).
Please also note that 0.383 refers to N'(d1) rather than the more familiar N(d1). So that's one way to represent a first derivative (It's called Lagrange's notation https://en.wikipedia.org/wiki/Notation_for_differentiation) of the function. Since N(.) is the cumulative standard normal distribution function, N'(d1) is the standard normal probability density function (i.e., integral of pdf is CDF and derivative of CDF is pdf). So in this case we can get N'(d1) with NORM.S.DIST(0.28, FALSE = pdf) = 0.383, but my XLS uses the full normal p.d.f =1/SQRT(2*PI())*EXP(-(0.28^2)/2) (see Hull 19.2). Then per Hull's gamma expression, (percentage) gamma is given by N'(d1)/[S(0)*σ*sqrt(T)] = 0.383/[$50*30%*sqrt(1)] = 0.0255. However, realistically, the calculation of gamma is likely beyond the scope of the exam. I happen to be confident because we were for years giving feedback to GARP to soften the Greek LOs. Previously, the LO's asked us to calculate/compute all of the Greeks, but the current syllabus contains "Compute the delta of an option" but then notice subsequently it only has "Define and describe theta, gamma, vega, and rho for option positions." (Of course I still believe in the value of a quantitative understanding, as in these exhibits, because sometimes you need that to really understand, say, just the dynamics of gamma). I hope that's helpful!

 Please note that we have since issued a (greatly) improved version of this Study Note, please see https://learn.bionicturtle.com/topic/study-notes-allen-chapters-2-3/ e..g, the table above has been replaced by (I hope you will agree!) the more readable display below (please note that I have not yet quite published the corresponding learning spreadsheet, there are a few more edits I still want to make).
Please also note that 0.383 refers to N'(d1) rather than the more familiar N(d1). So that's one way to represent a first derivative (It's called Lagrange's notation https://en.wikipedia.org/wiki/Notation_for_differentiation) of the function. Since N(.) is the cumulative standard normal distribution function, N'(d1) is the standard normal probability density function (i.e., integral of pdf is CDF and derivative of CDF is pdf). So in this case we can get N'(d1) with NORM.S.DIST(0.28, FALSE = pdf) = 0.383, but my XLS uses the full normal p.d.f =1/SQRT(2*PI())*EXP(-(0.28^2)/2) (see Hull 19.2). Then per Hull's gamma expression, (percentage) gamma is given by N'(d1)/[S(0)*σ*sqrt(T)] = 0.383/[$50*30%*sqrt(1)] = 0.0255. However, realistically, the calculation of gamma is likely beyond the scope of the exam. I happen to be confident because we were for years giving feedback to GARP to soften the Greek LOs. Previously, the LO's asked us to calculate/compute all of the Greeks, but the current syllabus contains "Compute the delta of an option" but then notice subsequently it only has "Define and describe theta, gamma, vega, and rho for option positions." (Of course I still believe in the value of a quantitative understanding, as in these exhibits, because sometimes you need that to really understand, say, just the dynamics of gamma). I hope that's helpful!

Last edited:
gargi.adhikari
Active Member
@David Harper CFA FRM Thanks so much for the above.Think for the sake of time, for now I will steer clear of this now since it is out of the scope of the exam...and revisit later for purposes of a better understanding/knowledge's sake...
Hi sm@23 It's not, the gamma term in Taylor is mathematically always positive (because it multiplies percentage--aka, per option--gamma which is always positive by a squared number). In the (2nd) example above (from our latest R25 Allen note), where the (percentage) delta is 0.6115 and the (percentage) gamma is +0.0255, the estimated delta-gamma change in the option price associated with a +$1.00 change in the stock price is given by ΔS*delta + 0.5*gamma*ΔS^2 = ($1)*0.6115 + 0.5*+0.0255*($1)^2 = 0.62425. Because percentage gamma must be positive and the ΔS is squared, when the stock price shock is negative, the gamma term will still add (consistent with the visual effect of the curvature/convexity); so, if ΔS is -$1.00, then the estimate is given by ΔS*delta + 0.5*gamma*ΔS^2 = (-$1)*0.6115 + 0.5*+0.0255*(-$1)^2 = -$0.5988. You just want to be careful if you switch the math and express the risk (which for the long position is drop in the stock price) into positive terms. More on this at https://forum.bionicturtle.com/thre...amma-value-at-risk-var-allen.7203/#post-28378 e.g.,
P.S. Percentage gamma (aka, per option gamma, or sometimes just "gamma) is always positive, but position gamma is negative for a short position.
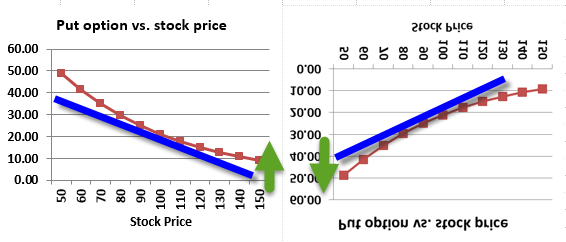
Hi @Anay I quickly created this image to explain. On the left is a long position in a put; on the right (i just flipped it!) is the corresponding short position in a put. In both cases, red is the actual non-linear payoff, while blue represents one of the tangents such that its slope is delta:

I think trying to frame in "add" or "subtract" is too hairy (difficult); e.g., is the VaR positive or negative? Rather, the point is:
In mathy terms, Taylor truncated to only two terms says: df = δf/δS*δS + 0.5*δ^2f/δS^2*dS^2 + ....
- If we are long the put, the risk is an increase in the stock price: the value predicted by the linear approximation (blue) is less than the actual value. However, we can say this different ways, right? although the actual value (red) is greater than the approximated (blue) value (option price), we can say "the actual loss is less than delta estimates" and, as VaR tends to be expressed in positive terms "the true VaR [i.e., loss expressed as a positive amount] is less than delta estimates" because the gamma (the curvature) works in our favor. This is an illustration of the advantage of being "long gamma," which the first term (delta) does not caputure.
- On the other hand, the short put (right side) is the opposite. Here the risk is a decrease in the stock price such that the linear approximated value (option price) is greater than the true value. This is being short gamma and it works against us. Now the actual loss is worse than estimated; i.e., the VaR is greater.
In the option context, that is df = ΔS*delta + 0.5*gamma*ΔS^2
I hope that helps!
- ΔS*delta is represented by the blue line. Consequently, ΔS informs df (change in option value) obviously:
- For a long put position, risk is +ΔS with linear impact: -df = +ΔS*(-delta)
- For a short put position, risk is -ΔS with linear impact: +df = -ΔS*(-delta)
- But 0.5*gamma*ΔS^2 is always additive in the Taylor Series because (ΔS^2) is positive regardless of up/down stock price
- For a long put position, that implies the positive gamma terms mitigates the negative delta term (-df); i.e., reduces risk
- For a short put position, that implies the positive gamma terms exacerbates the postive delta term (+df); i.e., increases risk
P.S. Percentage gamma (aka, per option gamma, or sometimes just "gamma) is always positive, but position gamma is negative for a short position.
Last edited:
thanks @David Harper CFA FRM for the explanation.
Similar threads
- Replies
- 1
- Views
- 292
- Replies
- 0
- Views
- 379
- Replies
- 1
- Views
- 581
- Replies
- 0
- Views
- 273
- Replies
- 0
- Views
- 454

