P2.T8.404. Information ratio, M-squared and the significance of performance

Nicole Seaman

Director of CFA & FRM Operations
Staff member
Subscriber
Questions:

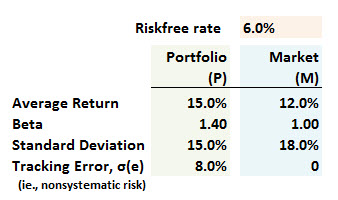
404.1. Consider the following performance data comparing a portfolio to its benchmark, the market, for a sample period:
T8.404_1

What is the portfolio's information ratio (IR) of the portfolio?

a. 0.075
b. 0.525
c. 0.760
d. 1.857


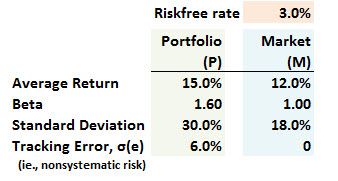
404.2. Consider the following performance data comparing a portfolio to its benchmark, the market, for a sample period:
T8.404_2

What is the portfolio's M-squared (M^2) measure?

a. -1.80%
b. 0.35%
c. 1.27%
d. 2.69%


404.3. Over an historical measurement period, a long/short equity hedge fund produced an alpha of +100 basis points per month. The monthly standard deviation of the residual (non-systemic) risk was only 5.0%. If we want a two-tailed 95% significance level, approximately how many years (N) are required to determine that the fund demonstrated skill, that is, such that we can reject the null hypothesis that his true alpha is zero?

a. 2 years
b. 8 years
c. 15 years
d. 37 years

Answers here:
 

prebhan27

New Member
Subscriber
Hello I have a question about 404.3. Why do we use the t-statistic here. I was using the z-statistic as we know the population standard deviation, which I thought is the tracking error (5%).
Thanks in advance for your help.
 

David Harper CFA FRM

David Harper CFA FRM
Subscriber
Hi @prebhan27 Right premise, but we do not know the population standard deviation; rather, the monthly standard deviation of 5.0% refers to the sample over N years. Actually, I should have included the word "observed" (which I typically do) to connote sample. So, a slightly better sentence would read, if this helps at all: "The monthly standard deviation of the residual (non-systemic) risk was observed to be only 5.0%." which is shorthand for "The monthly standard deviation of the residual (non-systemic) risk was only 5.0% over the observed (N) years." This is a typical question in the sense that we are testing for the unknowable population alpha which might be zero. But, at the same time, per the textbook, we use a critical value of 1.96: that's a large sample t-value which is basically using the critical z-value. So, in a practical sense, the assumption here doesn't matter, as we assume a large sample and approximate with a critical z value anyhow. I hope that is helpful!
 

adambschrier

New Member
Hi David,
404.2 I thought IR = (Return - Bench Return)/TE.....we are calculating alpha here - is using alpha the standard way or is there a way to know when to use which approach? thanks
 

Arnaudc

Member
@adambschrier ,
I guess you are referring to 404.1
Indeed the classical formula for IR is Alpha / Tracking error (this is what I have in my notes) with Alpha defined as usual = Rp - [rf + Beta p x (Rm - Rf) ]
Hope it helps..

EDIT:
On Investopedia, we read IR = (Rp - Ri) / Tracking error.. I assume the benchmark return has to be calculated based on portfolio Beta? (A bit confused as well here..)
 
Last edited:

David Harper CFA FRM

David Harper CFA FRM
Subscriber
Hi @adambschrier These question follows the assigned Bodie, who defines IR = α/σ(e), where α = alpha (aka, residual return) and σ(e) = non-systematic risk (as labeled). Bodie's imprecise usage (in my opinion) is unfortunate because, elsewhere and otherwise, tracking error connotes active return. Over the years, I've given considerable feedback to GARP on the IR definition and the current status (and has been for a while) is that two definitions are valid such that you can expect clear instruction:
  • IR (residual) = (alpha; aka, residual return)/residual risk, where alpha is a regression intercept or "net of beta factors;" for example, if Rf=2%, excess market (benchmark) return = 5%, and portfolio beta = 1.40, then for a portfolio return of +10.0%, the active return is 10% - 7% = +3%, but alpha = 10% - 2% - 1.40*5% = +1.0%. But also okay is:
  • IR (active) = (active return)/(active risk). So, as I've often written, they key is to be ratio-consistent: the denominator should be a standard deviation of the same return metric in the numerator.
More in my original post (including a good example by GARP) https://forum.bionicturtle.com/threads/information-ratio-definition.5554/
 

emilioalzamora1

Well-Known Member
Hi All,

I would like to add a couple of bullet points to the theory about the Information Ratio (IR) for a better understanding.

1.) In certain cases (in certain articles) alpha is defined as 'Tracking difference' which is the simple difference between the return generated by the manager and the benchmark return while 'Tracking Error' is the standard deviation over all these differences.

2.) The CAIA for example mentions the following: TE is most commonly viewed as std. deviation. However, some sources us the term TE to refer generally to the differences through time between an investment's return and benchmark return. When TE is used in the latter sense, the term Average Tracking Error simply refers to the excess of the an investment's return relative to its benchmark. In other words, it is the numerator of the Information Ratio or as we call it: it is the plain alpha.

3.) In some textbooks we may see the definition as given on the bottom of the Zephyr paper (link copied below), but please bear in mind that this definition is not very often applied in the industry. This is called the quadratic form of the TE.
If portfolio managers in the industry are talking about TE, then they refer to the standard deviation as described above. So, please be careful using the definition with the square root in the Zephyr paper or it's even better to safely ignore it. It just wanted to be consistent to have all options considered what are circulating around in various papers/articles/forums.

http://www.styleadvisor.com/resources/statfacts/tracking-error

4.) Paul Darbyshire 'Hedge Fund Modelling & Analysis' (p. 92-93) adds another version (apparently sometimes used in the Hedge Fund Industry, but which I have never seen myself anywhere else (I copied the formula in the attachment and for those interested in the book please give me a shout, I am happy to send to you in pdf-format). He writes:

'Many practitioners have argued that the quadratic form of the TE is difficult to interpret, and that hedge fund managers generally think in terms of linear and not quadratic deviations from a benchmark. In this case, TE in terms of mean absolute deviations (MAD)' (please see the formula in the attachment)

In general, we make the following assumptions about the IR:
  • Portfolio Managers seek to maximise the IR (reconcile a high residual return - alpha - with a low Tracking Error)
  • It is crucial to look at the value of the IR along with the TE (and never separately). For the same IR value, the lower the TE, the higher the chance that the manager's performance will persist over time.
  • The IR measures the additional return (alpha) achieved for accepting one unit more relative risk (TE).
  • As with all performance measures (Sharpe, Sortino, Treynor etc.) it is common practice in the industry the data numerator and denominator are annualised. It is crucial to use the same underlying return (same frequency).
  • At least 1 year of data is required to calculate the TE. The calculation of the IR for below 1 year is meaningless. When using monthly return data, ideally 3 years of data should be available to get a meaningful value. it is important to use the same underlying return
  • Alpha and TE are connected by the Fundamental Law of Active Management and it's hard to have a high alpha and a low TE over the same period.
  • The IR is similar to the Sharpe Ratio except that instead of absolute return (Sharpe uses the return on a particular stock/index to calculate the nominator), on the vertical axis we have excess return (this could be either pos. or neg. depending on whether the manager out-/underperforms the benchmark) and instead of absolute risk (standard deviation), on the horizontal axis we have TE or relative risk (std. deviation of the excess return or alpha) - hence, the alternative name 'Modified Sharpe Ratio'
  • The line of the IR always originates/starts from the origin; the gradient of the line is simply the ratio of excess return over TE.
  • If the underlying data is sufficiently large (5 or more years), then 1.) a IR of 1.5 represents a top portfolio 2.) a IR of 0.8-1.0 is very good 3.) a IR of 0.5 is average 4.) a IR of 0.2 is rather poor and 5.) a negative IR is bad since it's reveals that the manager does not generate alpha

    Morningstar provides some insight into the relationship between alpha (they call it tracking difference) and TE:

    'While it is often assumed that high tracking error means poor relative performance and low tracking error means good relative performance, our study shows that it is not necessarily the case. In fact, though there is a relationship between tracking error and tracking difference, it is not a particularly strong one. Tracking error and tracking difference can vary considerably over time and are very sensitive to the time horizon that is selected for their calculation.' (Morningstar, 'On The Right Track: Measuring Tracking Ef ciency in ETFs', Feb. 2013)

    I have copied quite a good fundamental industry paper with the title 'Higher Tracking Error: Be Careful What You Wish For' for further reading.

    https://17eb94422c7de298ec1b-8601c126654e9663374c173ae837a562.ssl.cf1.rackcdn.com/Documents/INTECH/White Papers/HigherTrackingError_BeCarefulWhatYouWishFor_exp12-30-16.pdf

    Thank you!


Attachments

  • TE Mean Absolute Deviation (MAD).pdf
    131 KB · Views: 8
Last edited:
Top