AIM: Describe the uses for the Modigliani-squared and Treynor’s measure in comparing two portfolios, and the graphical representation of these measures.
Questions:
17.1. The following data compares a Portfolio (P) to the Market (M):
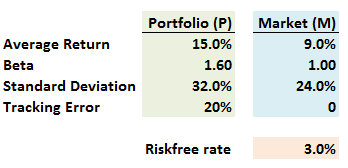
What is Modigliani-squared (M^2) measure of the portfolio?
a. -2.5%
b. +0.5%
c. +3.0%
d. +6.0%
17.2. The following data compares two portfolios, Portfolio (A) and Portfolio (B), to the Market(M):
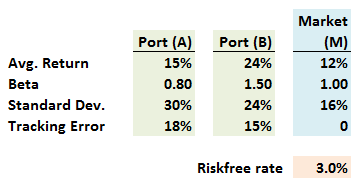
If we rank the portfolios according to, respectively, the Modigliani-squared (M^2) measure and slope of the T-line (equalizing for beta), how do the portfolios rank against each other?
a. Portfolio (A) offers both a higher M^2 and steeper T-line than Portfolio (B)
b. Portfolio (A) offers a higher M^2, but Portfolio (B) has a steeper T-line
c. Portfolio (B) offers a higher M^2, but Portfolio (A) has a steeper T-line
d. Portfolio (B) offers both a higher M^2 and steeper T-line than Portfolio (A)
17.3. The following data compares two portfolios, Portfolio (A) and Portfolio (B), to the Market(M):
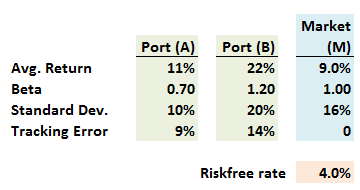
What are, respectively, the Treynor-squared (T^2) measure of Portfolio (A) and Portfolio (B)?
a. T^2(A) = -1.0% and T^2(B) = 1.7%
b. T^2(A) = 1.0% and T^2(B) = 2.8%
c. T^2(A) = 3.0% and T^2(B) = 7.5%
d. T^2(A) = 5.0% and T^2(B) = 10.0%
Answers:
Questions:
17.1. The following data compares a Portfolio (P) to the Market (M):
What is Modigliani-squared (M^2) measure of the portfolio?
a. -2.5%
b. +0.5%
c. +3.0%
d. +6.0%
17.2. The following data compares two portfolios, Portfolio (A) and Portfolio (B), to the Market(M):
If we rank the portfolios according to, respectively, the Modigliani-squared (M^2) measure and slope of the T-line (equalizing for beta), how do the portfolios rank against each other?
a. Portfolio (A) offers both a higher M^2 and steeper T-line than Portfolio (B)
b. Portfolio (A) offers a higher M^2, but Portfolio (B) has a steeper T-line
c. Portfolio (B) offers a higher M^2, but Portfolio (A) has a steeper T-line
d. Portfolio (B) offers both a higher M^2 and steeper T-line than Portfolio (A)
17.3. The following data compares two portfolios, Portfolio (A) and Portfolio (B), to the Market(M):
What are, respectively, the Treynor-squared (T^2) measure of Portfolio (A) and Portfolio (B)?
a. T^2(A) = -1.0% and T^2(B) = 1.7%
b. T^2(A) = 1.0% and T^2(B) = 2.8%
c. T^2(A) = 3.0% and T^2(B) = 7.5%
d. T^2(A) = 5.0% and T^2(B) = 10.0%
Answers: