AIMs: Explain the difference between cumulative and marginal default probabilities. Calculate risk-neutral default probabilities, and compare the use of risk-neutral and real-world default probabilities in pricing derivative contracts. Explain the various approaches for estimating price: historical data approach, equity based approach, and risk neutral approach. Describe how recovery rates may be estimated.
Questions:
415.1. Suppose a bond's observed credit spread of 160 basis points informs its hazard rate of default, where the assumed recovery rate is 36.0%. If default is driven by a Poisson process, which is nearest to the five (5) year cumulative default probability?
a. 8.00%
b. 9.25%
c. 11.75%
d. 12.50%
415.2. Each of the following is true about the estimation of default probabilities EXCEPT which is false?
a. If we examining historical data and use past default experience to predict future default likelihood ("historical data approach"), this is a real-world default probability
b. If we apply the Merton framework, where modeling default is transformed into assessing the future distribution of the firm's value and the barrier where default will occur, this is also a real-world default probability
c. If we estimate default probability from credit spreads observed in the market, this is a risk-neutral default probability
d. For a risk measurement application such as scenario analysis, risk-neutral probabilities should be used; for pricing applications such as the credit value adjustment (CVA), real-world probabilities should be used
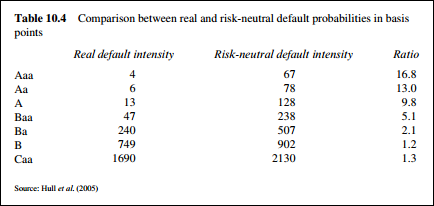
415.3. Let RN/RW be the ratio of risk-neutral default probability to real-world default probability for a given credit rating (e.g., Aa, Ba). Which of the following is true about the historical tendency of this ratio, as observed by Gregory (which is typical)?
a. The RN/RW ratio is approximately 1.0 across all ratings, as we would expect
b. RN/RW ratio is greater than 1.0 (i.e., risk-neutral probabilities are higher than real-world probabilities) and highest for better quality credits
c. RN/RW ratio is greater than 1.0 (i.e., risk-neutral probabilities are higher than real-world probabilities) and highest for worse quality credits
d. RN/RW ratio is less than 1.0 (i.e., real-world probabilities are higher than risk-neutral probabilities) and highest for worse quality credits
(Source: Jon Gregory, Counterparty Credit Risk and Credit Value Adjustment: A Continuing Challenge for Global Financial Markets, 2nd Edition (West Sussex, UK: John Wiley & Sons, 2012))
Answers here:
Last edited:


 , it's instructive I think (I write questions every day), fwiw: if the concept is about how the difference is measured (metric definition), it would be fine. But, invoking the magnitude of the ratio (and how it might be defined) diverts attention from the examined concept. The concept here is not how we define the difference between two quantities (a great topic for somewhere else) but rather something along the lines of: risk-neutral PDs are significantly higher than real-world; why is this true (important!); and maybe the difference correlates with rating. I am going to edit 415.3 to remove the (C) versus (B) distinction, based on ratio, and replace with a more relevant distinction. Thanks for your comment, great feedback!