Learning objectives: Describe the mean-variance framework and the efficient frontier. Explain the limitations of the mean-variance framework with respect to assumptions about return distributions.
Questions:
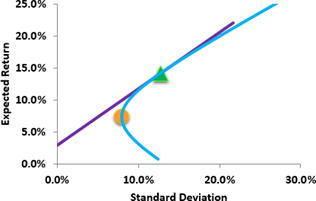
807.1. Displayed below is a plot of the Capital Market Line (CML) according to the mean-variance framework. There are only two risky assets:

Please note the graph also contains an Orange Circle and a Green Triangle. About this situation, each of the following is true EXCEPT which is false?
a. If the risk-free rate is constant at 3.0%, then the slope of the CML is invariant to the correlation between A & B returns
b. An investor can achieve an expected return greater than 20.0%, which is the expected return of Risky Asset B, if she is willing to borrow at the risk-free rate
c. The Green Triangle represents the Market Portfolio: it is entirely allocated between Risky Assets A & B but without any allocation to the risk-free asset
d. The Orange Circle represents the Minimum Variance portfolio: it generates a Sharpe ratio that in inferior to (less than) the Sharpe ratio of any position on the CML
807.2. Dowd explains that daily financial data can be expressed in either loss(+)/profit(-) format, or profit(+)/loss(-) format. For example, in profit(+)/loss(-) format which is more natural to the actual math, a asset's expected gain is represented by a positive value while it's loss is represented by a negative. However, in risk it is also convenient to use loss(+)/profit(-) format such that losses are expressed by positive values. (Kevin Dowd, Measuring Market Risk, 2nd Edition (West Sussex, England: John Wiley & Sons, 2005))
Assume our chosen format is loss(+)/profit(-), which is also just called "L/P." Our position's profits are normally distributed and given by the following two parameters:
a. -9.35
b. 15.08
c. 21.83
d. 42.57
807.3. Rebecca has determined that her equity portfolio's 25-day 95.0% confident absolute value at risk (aVaR) is given by -µ*Δt + σ*α*sqrt(Δt) = -12,000 + 208,000 = $196,000. She subsequently decides that she wants to translate this into a 10-day 99.0% confident aVaR. If the returns are i.i.d. and normally distributed, which of the following is nearest to the translated VaR?
a. 133,300
b. 150,000
c. 180,530
d. 195,400
Answers here:
Questions:
807.1. Displayed below is a plot of the Capital Market Line (CML) according to the mean-variance framework. There are only two risky assets:
- Risky Asset A has an expected return and volatility of 8.0%
- Risky Asset B has an expected return and volatility of 20.0%

Please note the graph also contains an Orange Circle and a Green Triangle. About this situation, each of the following is true EXCEPT which is false?
a. If the risk-free rate is constant at 3.0%, then the slope of the CML is invariant to the correlation between A & B returns
b. An investor can achieve an expected return greater than 20.0%, which is the expected return of Risky Asset B, if she is willing to borrow at the risk-free rate
c. The Green Triangle represents the Market Portfolio: it is entirely allocated between Risky Assets A & B but without any allocation to the risk-free asset
d. The Orange Circle represents the Minimum Variance portfolio: it generates a Sharpe ratio that in inferior to (less than) the Sharpe ratio of any position on the CML
807.2. Dowd explains that daily financial data can be expressed in either loss(+)/profit(-) format, or profit(+)/loss(-) format. For example, in profit(+)/loss(-) format which is more natural to the actual math, a asset's expected gain is represented by a positive value while it's loss is represented by a negative. However, in risk it is also convenient to use loss(+)/profit(-) format such that losses are expressed by positive values. (Kevin Dowd, Measuring Market Risk, 2nd Edition (West Sussex, England: John Wiley & Sons, 2005))
Assume our chosen format is loss(+)/profit(-), which is also just called "L/P." Our position's profits are normally distributed and given by the following two parameters:
- The drift, µ, is equal to -$15.0 per annum, and
- The volatility, σ is equal to $35.0 per annum.
a. -9.35
b. 15.08
c. 21.83
d. 42.57
807.3. Rebecca has determined that her equity portfolio's 25-day 95.0% confident absolute value at risk (aVaR) is given by -µ*Δt + σ*α*sqrt(Δt) = -12,000 + 208,000 = $196,000. She subsequently decides that she wants to translate this into a 10-day 99.0% confident aVaR. If the returns are i.i.d. and normally distributed, which of the following is nearest to the translated VaR?
a. 133,300
b. 150,000
c. 180,530
d. 195,400
Answers here:
