P1.T2.80.1 Confidence Intervals

CoinDrop

New Member
Hi BT forum,

Need your help, I'm thoroughly confused by this question and its answer - since the calculated t-value equals the critical t at 5%, aren't we saying we are accepting the null hypothesis that the population average refund mu=$882 (assuming that was the null since alternative is mu>$882)? And given that first step, isn't the question asking to calculate the 99% confidence interval for the "true" population average tax refund?

Looking at the answer though, it seems we are saying the population average is $1,000 like the sample. Can someone please explain why we would not be using mu = $882 +/- 2.898 * Std Error? (Seems the sample standard deviation formula also divides by sqrt(d.f.) when it should be sqrt(n)?)

thanks
 

David Harper CFA FRM

David Harper CFA FRM
Subscriber
Hi @CoinDrop That's interesting and, I think, instructive. Please note:
  • There is no assertion (assumption) that we accept or reject the null. Only a p value is given. And, it true, that the p-value let's us set the "the calculated t-value equal to the critical t at 5%." In this way, for the first step, an unstated 99% confidence would reject the null, and (to your point), a 95% confidence would "accept" (fail to reject) the null. But even though we aren't given that confidence/decision, it doesn't matter: we are just given the p value, which is informs a computed (calculated) t-value
  • Then the decision, even if to accept the null, is not really an acceptance of the null: it is a failure to reject the null. Why does this matter? Because, we could have set our null to be "true mean = 890" or "true mean = 920" ... any number of nulls would be accepted. Failure to reject the null (aka, "accept the null") does not imply the null is true (i.e., in this case, does not imply the true mean is 882).
  • The CI is carved around the sample mean, which is given as 1,000. That is an objective data point (as opposed to the null = 882, which is an arbitrary point that the human user selected). To illustrate the fallacy of your approach, different nulls would imply different CIs for the same sample mean. But, in theory, there is only one population mean (which itself is not a random variable), the CI is a random interval. I hope that helps,
 

CoinDrop

New Member
Ohhhhh....:eek:. Yikes, I understand the difference now, and at the same time REALLY worried I traveled down that path. Thanks for clearing this up for me.
 

Jhoony

New Member
Subscriber
Hello

I have a question about the t-statistics and the appropriate df? Sometimes I see that the appropriate df=n-1, sometimes df=n-k-1. In both cases I am dealing with a simple regression y=a +b1X. So there is k=1, another 1 stands for the alpha. In this case df=n-2. Why is sometimes the appropriate df only n-1?

If there is a multiple regression, is the formula df=n-k-1 almost valid or it can be df=n-k? Again 1 stands for alpha, k for the number of partial regression coef. (b).

Thank you
 

David Harper CFA FRM

David Harper CFA FRM
Subscriber
Hi @Jhoony

This is a common confusion because some authors define (k) as total number of estimated coefficients (as you seem to suggest), or even total number of variables (including dependent) which is the same number, while some define (k) without the slope/alpha coefficient (or similarly, without the dependent).

Further, in a regressions, if we clarify that k = slope coefficients or independent variables (e.g., k = 1 under univariate y=a +b1X), then:
  • ESS has k df
  • TSS (total) has n-1
  • RSS has n-k-1 such that df(TSS) = df(ESS)+df(RSS) = (n-1) = k + (n-k-1) <-- this should be easy to remember as TSS = ESS + RSS
In the most typical hypothesis test of a single (partial) slope coefficient--for example is (b1) significant in the univariate y = a + b(1)*x?--we are using RSS df so we want a t-test with n-k-1 df; in this case, just as you say, n-2. Although, a direct way to remember this is: the OLS regression computation must estimate two coefficients, (a) and b(1), so 2 df are consumed. I hope that helps,
 
Last edited:

lporfiris

New Member
Hi David,

I understand how to calculate a confidence interval for a given level of confidence (e.g. 95%), but I don't understand how to answer the question "How confident can you be that the true mean is above/below a certain number?". This is one of the sample questions in Miller Chapter 7. Once you compute the t-statistic, in the case of EOC #1, it is 0.54, how do you use that to calculate how confident you are that the true mean is above a certain number? Are you supposed to use the t-stat lookup table, or is there a calculation?

Thanks!
 

berrymucho

Member
Hi David,

I understand how to calculate a confidence interval for a given level of confidence (e.g. 95%), but I don't understand how to answer the question "How confident can you be that the true mean is above/below a certain number?". This is one of the sample questions in Miller Chapter 7. Once you compute the t-statistic, in the case of EOC #1, it is 0.54, how do you use that to calculate how confident you are that the true mean is above a certain number? Are you supposed to use the t-stat lookup table, or is there a calculation?

Thanks!

Say for testing a true mean greater than a value of mu, the null hypothesis you're seeking to reject is H0: mean < mu, or equivalently, H0: mean-mu < 0. That is, you want to use the lookup table for a single sided test. One-sided testing is for "greater/lower than" questions, two-sided testing is for "equal/different than" ones. Good luck.
 

lporfiris

New Member
Say for testing a true mean greater than a value of mu, the null hypothesis you're seeking to reject is H0: mean < mu, or equivalently, H0: mean-mu < 0. That is, you want to use the lookup table for a single sided test. One-sided testing is for "greater/lower than" questions, two-sided testing is for "equal/different than" ones. Good luck.
Thanks berrymucho. So that means I would have to look up the confidence level for 0.54 standard deviations of s on-tailed tes, right? I am just wondering how we would answer the question when the lookup table usually only has a few options for the number of standard deviations (the usual ones for 95% and 99% confidence)?
 

berrymucho

Member
Thanks berrymucho. So that means I would have to look up the confidence level for 0.54 standard deviations of s on-tailed tes, right? I am just wondering how we would answer the question when the lookup table usually only has a few options for the number of standard deviations (the usual ones for 95% and 99% confidence)?

I don't know the details of the specific example you're referring to so let me assume a normal distribution instead of a t-distribution with the appropriate degrees of freedom (as you know they get close after ~30 data points). A t-stat = (x_hat-mu)/s_x_hat = 0.54 indicates that the estimated mean x_hat is above the value mu. Now, looking up in the cumulative z-table for t~z=0.54, you get p=70.5% (note, this is one-sided). So if the question is "How confident can you be that the true mean is above/below a certain number?", in this case there's a 70.5% probability that the true (population) mean is greater than mu, and a 1-70.5%=29.5% probability to be lower than mu. You may want to sketch out a bell curve (centered on the estimated mean x_hat) to convince yourself. I think the trick is, the term "confident" in all generality does mean chance or probability, not automatically "confidence interval" which is actually a pair of quantiles that bound a certain probability and would involve a slightly different question. Hope this helps.
 

David Harper CFA FRM

David Harper CFA FRM
Subscriber
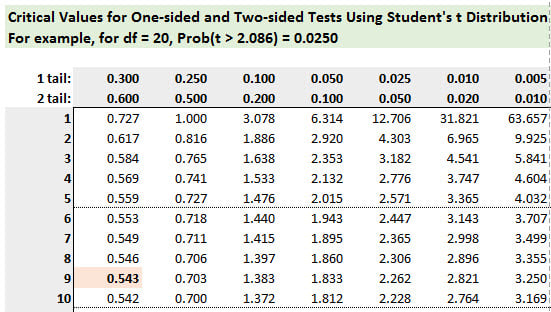
Hi @lporfiris The test statistic, in the case of the test for a sample mean, is giving us the number of standard deviations that separate the observed sample mean from the hypothesized null. In Miller EOC, the test statistic (as you point out) is only 0.54. Below I took the typical student's t lookup table and simply added an atypical first column: for 1-tail significance of 30% (0.30) and equivalently 2-tail significance of 60% (0.60). Imagine approaching this problem from the opposite direction: say we wanted to identify the critical student's t value that corresponds to a one-tailed 70% confidence level (with 9 degrees of freedom). The answer (in orange) would be 0.543; in other words, there is a fully 30.0% probability that a test statistic of 0.54 would be generated (due to sampling variation) if the null is true (null: the true mean is equal to 40 or less). Or, we can be only 70.0% confident that the null is not true. To answer your specific question then, although the function is actually just Excel's =T.DIST.RT(0.54, 9) = 30.1% or equivalently 1-T.DIST(0.54, 9, TRUE), we can also think of this as reverse-engineering the lookup table such that we are starting with the test statistic (the value in the cell, on the row corresponding to d.f., or more likely, the interpolated value conditional on the row) and scanning up to the top which implicitly identifies the p-value (aka, exact significance level). In this case, 0.54 standard deviations corresponds to (at the top) a p-value of 30.0% which is the exact significance level, which itself can be translated into words as "we can by (1-30%) or 70.0% confident in rejecting the null, which is to say, there is a 70.0% probability the true mean is greater than 40." I hope that clarifies!

0204-miller-eoc-0701.jpg
 
Top