Learning objectives: Explain two model selection procedures and how these relate to the bias-variance trade-off. Describe the various methods of visualizing residuals and their relative strengths. Describe methods for identifying outliers and their impact. Determine the conditions under which OLS is the best linear unbiased estimator.
Questions:
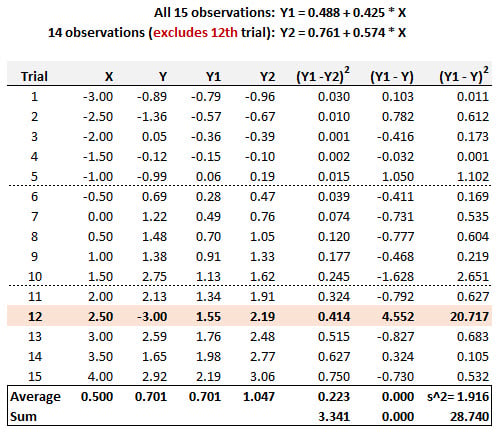
20.20.1. Below are displayed 15 pairwise (X,Y) trials. The simple regression line based on all 15 observations is given by Y1 = 0.488 + 0.425*X. We consider the possibility that the 12th Trial, given by point (X = 2.50, Y = -3.00) might be an outlier. If this point is removed, then the regression based on the other 14 observations is given by Y2 = 0.761 + 0.574*X. These results are displayed, including selected summary statistics.

According to Cook's distance, is the 12th Trial an outlier?
a. No, because its Cook's distance is negative
b. No, because its Cook's distance is 3.341/(2*1.916) = 0.872
c. Yes, because its Cook's distance is +0.15 (as given by the slope change)
d. Yes, because its Cook's distance is 1.916/(2*0.223) = +4.301
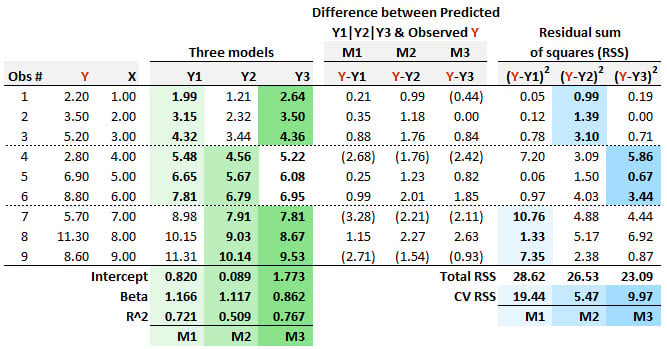
20.20.2. Patricia needs to specify a regression model, but she is only given nine (Y,x) pairwise observations, as displayed below. She employs m-fold cross-validation (CV) and selects three folds (aka, three blocks). Each of her three candidate regression models is "trained" on two of the folds, so that model can be "tested" on the remaining fold. The first model (M1 in light green) is a regression that is "trained" on the first six observations, and it is given M1: Y1 = 0.820 + 1.166*X. The second model (M2 in slightly darker green) is a regression that is "trained" on the last six observations, and it is given M2: Y2 = 0.089 + 1.117*X. The third model (M3 in darkest green) is a regression that is "trained" on the first three and last three observations, and it is given M3: Y3 = 1.1773 + 0.862*X.

For each model, the residual (i.e., the difference between the predicted and observed Y) is displayed. The final three columns display the squared residuals. If her criteria for model selection follows the principles of m-fold cross-validation then which of the three models should Patricia select?
a. She should select M1 because it has the highest CV RSS
b. She should select M2 because it has the lowest CV RSS
c. She should select M3 because it has the highest coefficient of determination
d. She should select M3 because it has the lowest total RSS
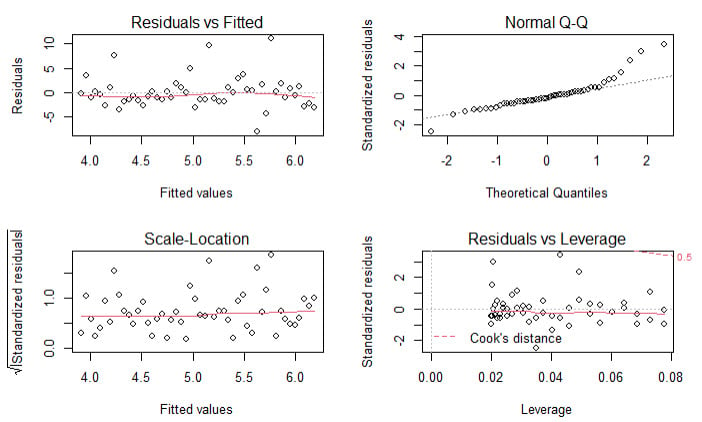
20.20.3. Patrick generated a simple regression line for a sample of 50 pairwise observations. After generating the regression model, he ran R's built-in plot(model) function which produces a standard set of regression diagnostics. These four plots are displayed below.

About these diagnostic plots, which of the following statements is TRUE?
a. There are many outliers
b. The data is significantly heteroskedastic
c. The residuals are a bit heavy-tailed (non-normal) on the right side
d. The residuals reveal that the relationship between the explanatory and response variable is non-linear
Answers here:
Questions:
20.20.1. Below are displayed 15 pairwise (X,Y) trials. The simple regression line based on all 15 observations is given by Y1 = 0.488 + 0.425*X. We consider the possibility that the 12th Trial, given by point (X = 2.50, Y = -3.00) might be an outlier. If this point is removed, then the regression based on the other 14 observations is given by Y2 = 0.761 + 0.574*X. These results are displayed, including selected summary statistics.

According to Cook's distance, is the 12th Trial an outlier?
a. No, because its Cook's distance is negative
b. No, because its Cook's distance is 3.341/(2*1.916) = 0.872
c. Yes, because its Cook's distance is +0.15 (as given by the slope change)
d. Yes, because its Cook's distance is 1.916/(2*0.223) = +4.301
20.20.2. Patricia needs to specify a regression model, but she is only given nine (Y,x) pairwise observations, as displayed below. She employs m-fold cross-validation (CV) and selects three folds (aka, three blocks). Each of her three candidate regression models is "trained" on two of the folds, so that model can be "tested" on the remaining fold. The first model (M1 in light green) is a regression that is "trained" on the first six observations, and it is given M1: Y1 = 0.820 + 1.166*X. The second model (M2 in slightly darker green) is a regression that is "trained" on the last six observations, and it is given M2: Y2 = 0.089 + 1.117*X. The third model (M3 in darkest green) is a regression that is "trained" on the first three and last three observations, and it is given M3: Y3 = 1.1773 + 0.862*X.

For each model, the residual (i.e., the difference between the predicted and observed Y) is displayed. The final three columns display the squared residuals. If her criteria for model selection follows the principles of m-fold cross-validation then which of the three models should Patricia select?
a. She should select M1 because it has the highest CV RSS
b. She should select M2 because it has the lowest CV RSS
c. She should select M3 because it has the highest coefficient of determination
d. She should select M3 because it has the lowest total RSS
20.20.3. Patrick generated a simple regression line for a sample of 50 pairwise observations. After generating the regression model, he ran R's built-in plot(model) function which produces a standard set of regression diagnostics. These four plots are displayed below.

About these diagnostic plots, which of the following statements is TRUE?
a. There are many outliers
b. The data is significantly heteroskedastic
c. The residuals are a bit heavy-tailed (non-normal) on the right side
d. The residuals reveal that the relationship between the explanatory and response variable is non-linear
Answers here:
Last edited by a moderator:
