P1. T1. Actual losses converge on the Expected loss?

yeng18950

New Member
Hello,

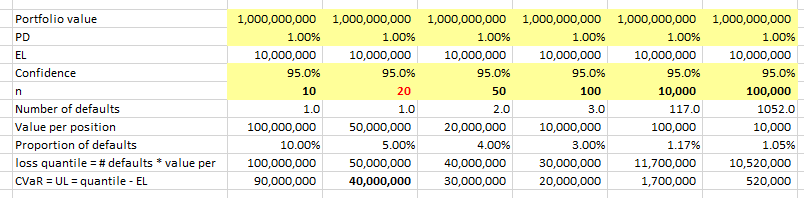
On page 8 of the study notes for P1.T1.Ch1, a statement is made about the relationship between actual loss & expected loss "The more granular (aka, less lumpy) is the credit portfolio, the more the actual losses should converge on the expected loss."

Would you please elaborate on this statement with an example, preferably a quantitative example if possible?

Thank you,
 

David Harper CFA FRM

David Harper CFA FRM
Subscriber
Hi @yeng18950 Variations on the the exhibit below (from Malz in P2.T6) appear in this forum a lot; e.g., https://forum.bionicturtle.com/thre...ion-malz-sections-8-1-and-8-2.6955/post-24169

Notice six columns, all for the same $1.0 billion portfolio value. But granularity increases as you move to the right. n = 10, n = 20, etc. All loans have the same PE = 1.0% so the EL = $10 million. But the first "lumpy" portfolio can't even generate actual loss equal to $10.0 M. Probably it will either be zero or $100.0 million. That's the point, hope it helps,

Hi Aloks: 309.3 mimics Malz Table 8.1, here is the XLS in case it useful http://trtl.bz/0509-t6-309-3
... snapshot below, 2nd column (n=20) is the base case in the question.
For any (n), EL = 1% PD * $1 billion = $10 million
  • when n = 20, 95% quantile= 1 default * 50 mm per position = $50 million, such that 95% CVaR (if n = 20) = 50 - 10 = $40 million
  • when n = 50, 95% quantile = 2 defaults * 20 mm per position = $40 million, such that 95% CVaR (if n = 50) = 40 - 10 = 30 million
In regard to (D), I maybe need to strengthen the wording but i think it's okay: the issue is that it's a 2% PD with 95% CVaR --> if we take the correlation up to 1.0, the UL = 0. I bookmarked to come back later when i can only b/c it looks okay to me currently, thanks,
0509-t6-309-3.png
 
Top