Yes you will need more of the underlying in case of shorting a put option but I think here it is not about magnitude alone. Put delta is negative so its rise in magnitude means it reduces.TwoL84 you wrote
16. Call Put Delta [ Call delta decrease , put delta increase ] -- Decrease/decrease. Put delta drops with moneyness.
Are you saying decrease/decrease is the answer? I think call delta decrease, put delta increase. Both can't move in the same direction. If have sold a call option and the underlying goes down in price, the option is less profitable to the buyer so I need less of the underlying to hedge. If on the other hand I sold a put and the underlying decrease, the likelihood of having to pay out increases so I need more underlying to hedge out all my risk.
You are using an out of date browser. It may not display this or other websites correctly.
You should upgrade or use an alternative browser.
You should upgrade or use an alternative browser.
Exam Feedback November 2015 Part 2 FRM Exam Feedback
- Thread starter Nicole Seaman
- Start date
I remember one question about netting graphs? I think I chose the flat graph
Asset allocation question - chose a/ 0.45% for asset
Asset allocation question - chose a/ 0.45% for asset
Yes, decrease/decrease. If you decrease the underlying's price, call delta decreases as the call becomes less likely to be in the money. A put's delta ranges from 0 to -1, so if the underlying decreases in price, the put's delta becomes more negative (ie decreases) to reflect the increased moneyness.
If you're asking about that case study question, VaR will not be 0..
Can you recall the question? I think it's 0.86 but I can tell for sure with the question.
It's the one that increases then plateaus.
On the asset allocation question, I can't recall my answer but you can work it out with the TEV allocation formula.
Feels different to be able to discuss questions after the exam, especially after how tight CFAI is about non-disclosure.
An index halted trading for 5 weeks, during that 5 weeks, would the VaR of a portfolio that replicated the index be 0 or unchanged from before the halt in trading. Would the VaR immediately after trading resumed be the same as when trading was halted,higher or lower.
If you're asking about that case study question, VaR will not be 0..
Guys... what was the answer of convexity? 1.86 bp or 0.86 bp... I guesses 1.86...
Can you recall the question? I think it's 0.86 but I can tell for sure with the question.
I remember one question about netting graphs? I think I chose the flat graph
It's the one that increases then plateaus.
On the asset allocation question, I can't recall my answer but you can work it out with the TEV allocation formula.
Feels different to be able to discuss questions after the exam, especially after how tight CFAI is about non-disclosure.
One question that stuck out for me was along the lines of:
An index halted trading for 5 weeks, during that 5 weeks, would the VaR of a portfolio that replicated the index be 0 or unchanged from before the halt in trading. Would the VaR immediately after trading resumed be the same as when trading was halted,higher or lower.[
I selected Var will decrease.
Yes you will need more of the underlying in case of shorting a put option but I think here it is not about magnitude alone. Put delta is negative so its rise in magnitude means it reduces.
Mathematically speaking under BSM, Call Delta - 1 = Put Delta. e.g. Call Delta = 1 then Put Delta = 0
So they must increase/decrease at the same time
if you can read the chapter "Delta Hedging" in "Options, Future and other derivatives" by John Hull you will see this clearly with a couple of graphs of how put and call delta behave as stock price changes. Delta is the rate of change of the derivative with respect to the change in price of the underlying,
The graphs show delta rising from 0 to 1 as stock price increases. On the other hand, delta rises from -1 and approaches, but never reaches 0 for the put.
I have 4th edition of Hull book and then graphs are on page 313, figure 13.3.
The graphs show delta rising from 0 to 1 as stock price increases. On the other hand, delta rises from -1 and approaches, but never reaches 0 for the put.
I have 4th edition of Hull book and then graphs are on page 313, figure 13.3.
I remember one question about netting graphs? I think I chose the flat graph
Asset allocation question - chose a/ 0.45% for asset
the correct answer was the graph increasing... I am sure. I have put many point and calculated the net factor/ diversification.
I recall few question, anyone can help to provide your thought
1. Ops gross loss, use what value for the counts. I choose replacement cost instead of book value
2. 4 million CVA maximum, i chose position 4.. seems to be easy [might be trapped]
3. change position, transfer USD800000 to other asset, i chose VaR decreasing USD2XXXXX
4. Jeasen inequality convexity, i chose 0.86 basis point
Sorry I wanted to say decrease/increase for call/put.
see this
Sorry I wanted to say decrease/increase for call/put.
Mathematically speaking under BSM, Call Delta - 1 = Put Delta. e.g. Call Delta = 1 then Put Delta = 0
So they must increase/decrease at the same time
It is decrease/decrease because moving closer to -1 for a put, which happens as the underlying is devalued and a call's delta moves to 0, is a DECREASE, not an increase.
SorryIt is decrease/decrease because moving closer to -1 for a put, which happens as the underlying is devalued and a call's delta moves to 0, is a DECREASE, not an increase.
What i mean is increase or decrease at the same direction.
It is impossible to move in opposite direction
see this
Dube, the graph is correct. But please be noted that the X aixs is Moneyness but not the stock pice.
If changes as Stock price, the graph will change and you know that the Deltas will move in the same direction.
I can't remember what some of my answers were. These are the ones which I can remember and which I had different answers for/or reservations over the answers:
3. OIS- 4/4.5% - LIBOR -5% [ 1100 - guess] -- This is 1009 or something.
16. Call Put Delta [ Call delta decrease , put delta increase ] -- Decrease/decrease. Put delta drops with moneyness.
33. Alpha, Beta , Gamma [ Beta will face funding risk ] -- Not sure about this one, and I think it's partly because GARP isn't always clear with the way answers are worded. You could argue there is some form of funding risk in that Beta cannot provide cash to Alpha, but Beta freezing a repo line in which it provides funding is funding risk to Alpha, not Beta. I think the better answer is the one where Beta's operational risk is reduced. External fraud (even made clear in the question) is an operational risk which would be minimised by a clearinghouse.
-A floating rate note with 4 periods of time, ¿what was the period with highest exposure? -[ i guessed T/2 , not sure.] -- This one threw me for a loop too. Not sure what the correct answer should be, but went with T=2. Could be completely wrong, but the FRN shouldn't pose counterparty risk to the firm that is paying the coupons/face, which leaves just the swap (notice the question asks about c/p risk to the company AND the bank). XCS have credit risk profiles weighted towards the end of the swap, IRS have heavier weightages in the middle. If there had been an option for T=1 / 0.5 years, that would have been interesting as EE has a 0.4 multiplier. Since there isn't, I felt T=2 / 1yr was the best, could be wrong.
___________________________________
3. OIS- 4/4.5% - LIBOR -5% [ 1100 - guess] -- This is 1009 or something. - Could be ..i just randomly guessed due to lack of time management
16. Call Put Delta [ Call delta decrease , put delta increase ] -- I just went with simple logic that as the option is becoming less valaubale/ more valuable it should be priced accordingly.
33. Alpha, Beta , Gamma [ Beta will face funding risk ]- Beta not providing cash to apha is not a funding risk to Beta.
A floating rate note with 4 periods of time- Again tried guessing wth logic. i could be wrong
ITM/ATM/OTMWhat is moneyless? Stock price - strike price. strike price is constant. In John the graph is captioned "variation of delta with stock price for a call option and a put option on a non dividend paying stock".
The question saying that the stock price decreased to $18, so x-axis should be stock price rather than ITM/ATM/OTM
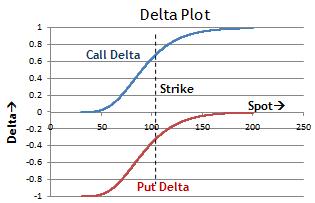
Both graphs are fine if you can interpret them properly. To illustrate:
Strike is 50 for both, the price can be either 5 or 95 for the underlying.
Price = 95
Call delta: close to 1
Put delta: close to 0
Price = 5
Call delta: Close to 0
Put delta: Close to -1
Call delta going down is coupled with put delta decreasing (0 => -1 is a decrease) as the put is increasingly in the money.
It's really not that confusing.
Similar threads
- Replies
- 2
- Views
- 662
- Replies
- 9
- Views
- 2K
- Replies
- 9
- Views
- 3K
- Replies
- 2
- Views
- 555
- Replies
- 5
- Views
- 1K