Convexity in Hull

Hi David,

Hull has a statement about convexity that does not seem to agree with what you have. You state that convexity will decrease as the coupon increases.

Hull says "the convexity of a bond portfolio tends to be greatest when the portfolio provides payments evenly over a long period of time. It is least when payments are concentrated around one point in time." To me, it seems like a high coupon would be like spreading the payments out more evenly. In other words, according to Hull it seems like a high coupon (which would lead to a more even distibution of payments) would lead to higher convexity. Am I thinking about this completely incorrectly?

Also, with a question like this, aren't there some secondary effects we must also consider, like how a high coupon bond would have a higher price and therefore a lower yield than a low coupon bond?

For instance, a bond with an 8% coupon will be more expensive, and have a lower yield, than a bond with a 4% coupon. How do these effects net out as far as duration and convexity are concerned? In other words, a higher coupon will lead to a lower yield. A higher coupon is supposed to lead to a lower duration and convexity while a lower yield will lead to a higher duration and convexity.

Sorry for the long question. Any explanation would be greatly appreciated.

Thanks,
Mike
 
Hi David,

I emailed Hull and this was his response:

The latest edition says: “For a portfolio with a particular duration, convexity is greatest when….” I think this is true.

Mike
 

David Harper CFA FRM

David Harper CFA FRM
Subscriber
Hi Mike,

First, I am envious you got a reply from John Hull. I never got a reply from John Hull. What is your secret?

Really interesting. Both statements are true and, while i recognize exactly what Hull means by "when the portfolio provides payments evenly over a long period of time," it can be interpreted more than one way (imo). I think he means to make a PORTFOLIO point and therefore means to say what Tuckman says (please note, not only is Tuckman the primary assignment for bonds, but as his whole focus is fixed-income, he is naturally deeper here):
"A barbell has greater convexity than a bullet because duration increases linearly with maturity while convexity increases with the square of maturity. If a combination of short and long durations, essentially maturities, equals the duration of the bullet, that same combination of the two convexities, essentially maturities squared, must be greater than the convexity of the bullet. In the example, the particularly high convexity of the 30-year zero, on the order of the square of 30, more than compensates for the lower convexity of the two-year zero. As a result, the convexity of the portfolio exceeds the convexity of the nine-year zero."
... put another way, as convexity increases with the square of maturity, spreading out the BONDS within a PORTFOLIO implies more bonds with longer maturities, which will have a disproportionate impact convexity

It is the exact same idea that gives rise to the true statement that "Bond convexity increases with maturity, decreases with coupon rate, and decreases with yield." (p 26 of Interest Rate Modeling, Nawalkha --- my go-to source on this); i.e., in my words, as convexity is the weighted average of maturity-squared of bond, LOWER coupon rate implies more weight on the final principal, which is the longest maturity cash flow. This is similar to duration, lower coupon rate clearly implies higher duration and higher convexity.

On your last point, re secondary effects: yea, that could get hairy. As a vanilla bond has 5 inputs (see the 3rd row on your calculator), we generally mean:
if we change something, what is the impact if we hold all other things equal (ceteris paribus is an implicit assumption in 90% of these questions!) except for price, which we let change or it would get crazy.

So generally this is not the assumption, not "a bond with an 8% coupon will be more expensive, and have a lower yield, than a bond with a 4% coupon. "
more like, if we increase coupon (higher coupon) from 3% to 4%, then we assume same maturity, same yield, same face value, and we let the price increase (we would NOT infer lower yield b/c the coupon increased; think of those as their 2 different keys on the calculator)

I hope that helps, David
 
Hi David,

Hull has actually gotten back to me a couple of times. Quick, one sentence, replies but has been pretty helpful.

Thank you for the thorough response. The one thing I am having trouble wrapping my head around is you say that if coupon increases, we cannot assume a decrease in yield. I have gone through Excel a number of times where I made up a term structure of interest rates and then switched the coupon and used solver to find the YTM. The yield seems to go down as coupon (and price) go up. Isn't it the term structure of rates that actually determines the prices and yields on these bonds anyway?

In other words, if we keep everything the same (face, coupon, number of payments) on the calculator but change the yield, doesn't that imply that the term structure is changing and this will also change the present value (price) of the bond?

Once again, thanks in advance for any clarity you could provide.

Mike
 

David Harper CFA FRM

David Harper CFA FRM
Subscriber
Hi Mike,

"Hull has actually gotten back to me a couple of times." Salt in my ego wound. Can I get an appointment with him through you? :)

If you are using (let's say) the theoretical term structure of Treasury SPOT rates ("theoretical spot rate curve") and fixing that, you are fixing bond prices: the fundamental bond building block is the direct relationship between spot (aka, zero) rates and bond prices. As price = F[bond face discounted at spot rate], it's almost tautological to ask which is the egg and which is the chicken; e.g., if you buy a bond, are you buying the price or the rate?

So, my example looks like:
10-year bond, 3% s.a. coupon, 6% yield --> price is $77.68
if coupon increases to 4%, then price increases to $85.12 (an "exam-like approach" if you will)

I think your real-world example is analogous to:
observe $77.68; important note: this is no different than observing a spot/zero rate
if keep this price fixed, increase coupon to 4%, then yield must increase to 7.2%

we have 5 variables. in the first above, we hold yield constant and let the price increase. in the second, we hold price constant, and let the coupon increase.

importantly, "yield" implies "yield to maturity" (YTM) and YTM is not the spot/zero rates. The term structure is a picture of a series of spot/zero rates; the "yield" (YTM) impounds all of the relevant spot prices (as exogenous "out there"), and as a function of the bond price, into a single number that I don't think can be separated from the bond itself.

Hope that helps, David
 
Hi David,

Float me a question and I will see what I can do. haha

I completely agree with what you are saying as far as the calculator is concerned. What I was attempting to say, although it may not have been clear, is that if a term structure is fixed, a 5% coupon bond and an 8% coupon bond that both mature on the same day will have different prices and slightly different yields. Is this correct so far?

Therefore, if everything in the "real world" stays the same (terms structure of interest rates), if we increase the coupon of the 5% bond to 8%, not only does the price change, the yield changes.

In order for the yield to stay the same if we increased the coupon the term structure would have to change in the exact right way. I think that would just be dumb luck.

I included a a copy of a spreadsheet to show you what I am talking about.

Thanks,
Mike
 

David Harper CFA FRM

David Harper CFA FRM
Subscriber
Hi Mike,

(your spreadsheet appears to be a word .doc, might you upload the xls?)

I agree with everything is your last; I think I see your point: there is a difference between the calculator (which only uses YTM as an input) versus the term structure (which uses a series of spot rates).

Your test, I think, can be nicely applied in this XLS: http://www.bionicturtle.com/how-to/spreadsheet/2011.t4.c.2.-spot-forward-rates/

Note that we can take, as a given, the term structure: 1% @ 0.5 years, 2% @ 1.0 years ... (upward sloping zero rates).
If we increase the coupon input, the yield (YTM) as an output changes; for this term structure, the YTM happens to go down; e.g., coupon from 6% to 9% --> YTM from 4.88 to 4.83%.
(but i don't think it is necessarily down, i *think* it depends on the term structure)
This "proves" your statement: if we increase the coupon of the 5% bond to 8%, not only does the price change (price goes up here), the yield changes.
of course, the reason is that what does not change is the term structure, so we are discounting higher coupons (futures cash flows) with unchanged discount rates.

In this test of your statement, the yield (YTM) is more real-world in the sense that it (YTM) is an OUTPUT and the term structure and coupons are inputs.

The calculator cannot really do the same "what-if" directly as it uses YTM as an input ... so, i did not think of this before, but this would seem to imply:
If we start with (eg) 10-year bond, 3% s.a. coupon, 6% yield—> price is $77.68
then ask, what if we increase the coupon to 4% --> the price increases to $85.12 (the “exam-like approach”)
... it seems to necessarily follow, to agree with you, that because we have assumed 6% constant yield, the term structure must change to keep the yield constant given the higher coupons.
... i think this makes sense: the YTM is a function of [term structure, price which in turn is function of coupons], so that the "calculator approach" of holding yield constant actually assumes some variation in its inputs

David
 
Hi David,

I tried to upload the sheet, but it kept telling me that it was an invalid file format. I tried two different versions of Excel and it still didnt work.

I could email it to you if you would like. Its not terribly sophisticated. I just keep using solver after I manually change the coupon.

Thanks again for all your help with this.

Mike
 

David Harper CFA FRM

David Harper CFA FRM
Subscriber
Thanks, but maybe since my XLS supports your point it isn't necessary? I would look into the forum format issue, but our new forum (xenforo) is almost ready to deploy, so .... (lots better features!), thanks, David
 

berrymucho

Member
Bond price dependencies I found difficult to "picture" all at once given the multiple dimensions... I ended up preparing the charts in attachment, which is a good way to get the equations "in your system" and understand how and why they behave this way. Next, I memorized this array of charts so I can picture any one of these relationships during the exam. It worked for me. Enjoy.
 

Attachments

  • bonds_price_dep.pdf
    62.6 KB · Views: 12
Last edited:

David Harper CFA FRM

David Harper CFA FRM
Subscriber
@berrymucho so cool, thank you! What software are you using to do that, can I ask (I like the clean facets)?

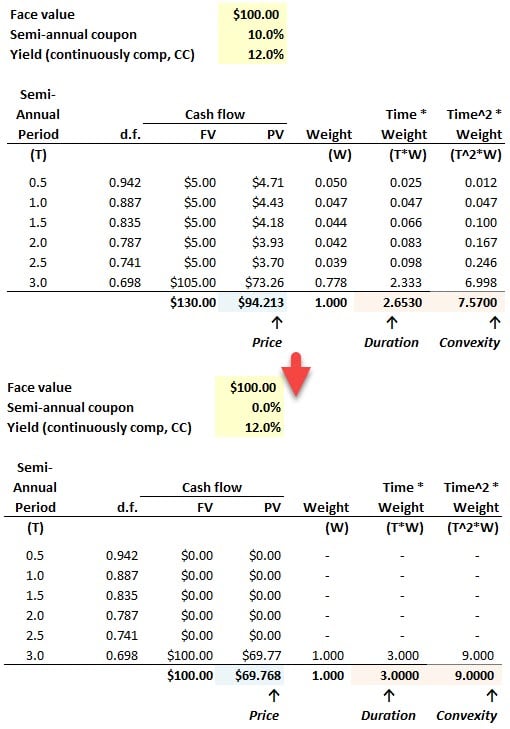
Hi @gargi.adhikari One way to grasp this is to realize that duration is the weighted average maturity of the bond, and similarly, convexity is the weighted average of maturity-squared of the bond. See below (XLS is here https://www.dropbox.com/s/f1pfcy4nvyt9pr4/0919-bond-convexity.xlsx?dl=0 )

In the top panel is a 10% coupon bond. Notice how the convexity of 7.57 is retrieved as the sum of the final column; this column is the weight (W) multiplied by T^2. The same weights are used to retrieve duration. The weights are simply the PV cash flows as a percentage of the bond's price. In the lower panel, I drop the coupon way down to zero: all of the weight goes to the final cash flow. In this way, as coupon rate goes lower, the duration and convexity increase because the weight accumulates toward greater maturities (such that, to answer your question: yes, a zero coupon bond has the highest [mac] convexity equal to maturity-squared, among the set of "vanilla" bonds, although I believe an inverse floater can leverage to a convexity that's greater than maturity). This is an illustration of Tuckman's text, I hope that clarifies!:
"Considering all of the curves of Figure 4.7 together reveals that for any given maturity duration falls as coupon increases. (Recognize that the par bond in the figure has a coupon equal to the yield of 3.50%.) The intuition behind this fact is that higher-coupon bonds have a greater fraction of their value paid earlier. The higher the coupon, the larger the weights on the duration terms of early years relative to those of later years. Hence, higher-coupon bonds are effectively shorter-term bonds and therefore have lower durations." --Tuckman, Bruce; Serrat, Angel. Fixed Income Securities: Tools for Today's Markets (Wiley Finance) (p. 147). Wiley. Kindle Edition.

0919-convexity-zero.jpg
 

gargi.adhikari

Active Member
Thanks so much @David Harper CFA FRM for the explanation above and Thanks @berrymucho for the visual charts - it definitely helps a lot to have a visual map for the different forces affecting Bond Prices. Cannot thank you enough for the charts :):)

On a second note, I now understand mathematically how the Convexity ends up being more for 0-coupon Bonds. But i think it is a bit counter intuitive...if Coupons are higher-> that's good for the Investor as he is promised higher payments for his investment-> Leads to Higher Bond Prices than regular projected prices on the Tangent straight Line. Higher Bond Prices -> Higher +ve Convexity..? am I getting something wrong in this ... ? :(:(:confused::confused:
 

David Harper CFA FRM

David Harper CFA FRM
Subscriber
@gargi.adhikari Yes, you are right about the first part. Starting from the bottom panel above, the zero-coupon bond has a price of $69.768. Then we increase the coupon to 10.0% (dramatic, I know!) and the bond price does increase to $94.213 (as you say, coupons are better for the investor than no coupons :)). But notice the weights column. The weights must sum to 1.0 = 100%. In the upper panel, the introduction of coupon cash flows "dispersed" or titled some of the weight to lower maturities; i.e., the coupon bond has a shorter weighted average maturity. See how that illustrates Tuckman's text that I quoted above? Thanks,
 

berrymucho

Member
Thanks so much @David Harper CFA FRM for the explanation above and Thanks @berrymucho for the visual charts - it definitely helps a lot to have a visual map for the different forces affecting Bond Prices. Cannot thank you enough for the charts :):)

On a second note, I now understand mathematically how the Convexity ends up being more for 0-coupon Bonds. But i think it is a bit counter intuitive...if Coupons are higher-> that's good for the Investor as he is promised higher payments for his investment-> Leads to Higher Bond Prices than regular projected prices on the Tangent straight Line. Higher Bond Prices -> Higher +ve Convexity..? am I getting something wrong in this ... ? :(:(:confused::confused:

@gargi.adhikari, you're welcome. I always feel I'm missing something when discussing equations in plain English, I like visuals...
@David Harper CFA FRM, my go-to software is R ... for pretty much everything (my 2nd brain). It takes a little bit of time to create nice looking charts but once they're coded, they're easy to modify and re-create (all at once). I was confused in some quizzes (not BT's) talking loosely about "price change" with the fact that DV01 ($ price change) increases with the coupon but duration (% price change) decreases with the coupon (2 center charts in the panel), so I ended up charting all the dependencies.
Oh, and I have a similar series of charts for options prices and the Greeks as well...
 
Last edited:
Top