You are using an out of date browser. It may not display this or other websites correctly.
You should upgrade or use an alternative browser.
You should upgrade or use an alternative browser.
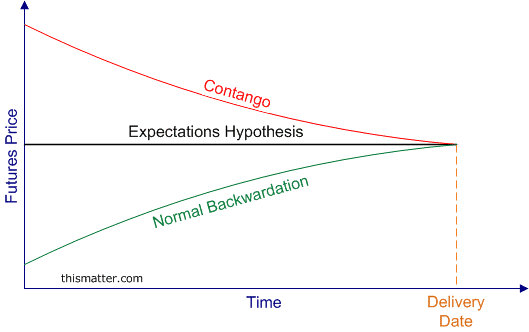
backwardation chart
- Thread starter jack11961
- Start date
-
- Tags
- backwardation
Hi @jack11961 But they are both saying (correctly) the same thing:
- As time marches forward (moving forward in time), under normal backwardation (assuming constant or at least non-decreasing spot) the futures price is increasing; or equivalently
- By definition of normal backwardation the futures price is an decreasing function of maturity; i.e., S(0) > F(+1 month) > F(+2 months)
Similar threads
- Replies
- 3
- Views
- 1K
- Replies
- 0
- Views
- 123
- Replies
- 0
- Views
- 202


