Please explain and provide their formula to calculate the results without using the excel. I am having difficulties understanding the numbers given. Thank you.
Please explain and provide their formula to calculate the results without using the excel. I am having difficulties understanding the numbers given. Thank you.
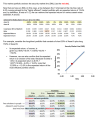
@mary1997 The example assumes two assets: Asset A with a 10% expected return and 10% standard deviation, and Asset B with a 16% expected return and 20% standard deviation. The risk-free rate is 6%, the correlation between A and B is 0.30, and their covariance is 0.006. The "most efficient" market portfolio holds 56.82% in Asset A and 43.18% in Asset B, yielding an expected return of about 12.6% and a standard deviation of about 11.67%, which produces the maximum Sharpe ratio of 0.5645.
To find beta for any portfolio without Excel, you use Beta = Cov(portfolio, market) / Var(market). Start by computing how each asset co-varies with the market: Cov(A, market) = 0.5682 x 0.0100 + 0.4318 x 0.0060 = 0.008272, and Cov(B, market) = 0.5682 x 0.0060 + 0.4318 x 0.0400 = 0.020681. For any portfolio with weights w_A and w_B, multiply each by its respective covariance with the market, add them together, then divide by Var(market) = 0.013628. For the -50% A / +150% B portfolio, that gives (-0.50)(0.008272) + (1.50)(0.020681) = 0.026886, and 0.026886 / 0.013628 = 1.972, which matches the table exactly.
Once you have beta, the CAPM formula does the rest: E(R) = Rf + Beta x (E(R_market) - Rf) = 6% + Beta x 6.6%. For a beta of 1.972, that gives 6% + 1.972 x 6.6% = 19.0%, again matching the table. The reason both "Expected Return" rows in the table are identical is that every combination of these two assets lies directly on the Security Market Line. Beta simply measures how much systematic risk your portfolio carries relative to the market, and the CAPM compensates you proportionally for taking on that extra risk above the risk-free rate.
This site uses cookies to help personalise content, tailor your experience and to keep you logged in if you register.
By continuing to use this site, you are consenting to our use of cookies.