Learning objectives: Define coherent risk measures. Estimate risk measures by estimating quantiles. Evaluate estimators of risk measures by estimating their standard errors. Interpret QQ plots to identify the characteristics of a distribution.
Questions:
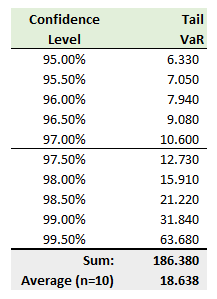
709.1. Sally is a Risk Analyst who wants to estimate the 95.0% expected shortfall (ES) but finds it much easier to retrieve the extreme quantiles of the distribution, which are shown below:

Based on these quantiles, which of the following is the BEST estimate of the 95.0% expected shortfall (ES)?
a. 7.05
b. 12.73
c. 18.64
d. 20.00
709.2. About the concept of coherent risk measures, which of the following statements is necessarily TRUE?
a. Value at risk (VaR) is never sub-additive
b. Coherent risk measures have smaller standard errors than non-coherent risk measures
c. Among the coherent risk measures, expected shortfall (ES) is the best among the alternatives
d. Expected shortfall (ES) satisfies each property of: monotonicity, subadditivity, positive homogeneity, and translational invariance
709.3. Peter is a Risk Analyst who has collected a dataset and seeks to fit a relatively simple univariate distribution to the data. He hopes the data is approximately normal. To test this hypothesis, he generates a quantile-quantile plot (QQ plot) using a standard normal distribution as the reference. This QQ plot is displayed below:

Based on the QQ plot, which statement is most likely to be TRUE about this distribution?
a. The distribution is approximately normal
b. It has light tails (left and right) with positive skew
c. It has a very heavy left tail, a light right tail and negative (aka, left) skew
d. It has a very heavy right tail, a light left tail and positive (aka, right) skew
Answers here:
Questions:
709.1. Sally is a Risk Analyst who wants to estimate the 95.0% expected shortfall (ES) but finds it much easier to retrieve the extreme quantiles of the distribution, which are shown below:

Based on these quantiles, which of the following is the BEST estimate of the 95.0% expected shortfall (ES)?
a. 7.05
b. 12.73
c. 18.64
d. 20.00
709.2. About the concept of coherent risk measures, which of the following statements is necessarily TRUE?
a. Value at risk (VaR) is never sub-additive
b. Coherent risk measures have smaller standard errors than non-coherent risk measures
c. Among the coherent risk measures, expected shortfall (ES) is the best among the alternatives
d. Expected shortfall (ES) satisfies each property of: monotonicity, subadditivity, positive homogeneity, and translational invariance
709.3. Peter is a Risk Analyst who has collected a dataset and seeks to fit a relatively simple univariate distribution to the data. He hopes the data is approximately normal. To test this hypothesis, he generates a quantile-quantile plot (QQ plot) using a standard normal distribution as the reference. This QQ plot is displayed below:

Based on the QQ plot, which statement is most likely to be TRUE about this distribution?
a. The distribution is approximately normal
b. It has light tails (left and right) with positive skew
c. It has a very heavy left tail, a light right tail and negative (aka, left) skew
d. It has a very heavy right tail, a light left tail and positive (aka, right) skew
Answers here:
