Questions:
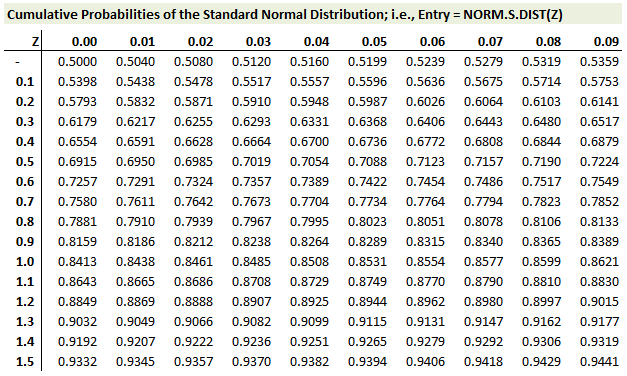
Note: for the questions below, we provide the following snippet from the standard normal CDF lookup table:

323.1. Assume a stock price following a geometric Brownian motion (GBM) process such that the natural log of the future stock price, S(t), is approximately normal:

The current stock price, S(0), is $48.00 with volatility of 36.0% per annum. The expected return (mu) is 18.0% per annum. Assuming this model, which is nearest to the probability that the stock price will end the year (T = 1.0) above $60.00? [Sidebar bonus question: Why is the answer different than N(d2) in BSM, or is it the same?]
a. 17.03%
b. 24.55%
c. 38.21%
d. 44.82%
323.2. Analyst Peter needs to price an American call option with one year to maturity. He has convenient access to only two option pricing models: a Black-Scholes Merton (BSM OPM), which he presumes is exact due to its analytical solution; and a binomial tree with twelve steps, which he presumes is inaccurate due to the low number of steps. He performs the following calculations:
a. Antithetic variable technique
b. Control variate technique
c. Quasi-random sequences
d. None of the above, Peter's method is without merit
323.3. A Monte Carlo simulation (MCS) assumes that a non-dividend-paying stock follows the process given by the discrete-time version of geometric Brownian motion (gBm):

The initial stock price, S(0), is $100.00. The expected return (mu) is 15.0% per annum. The volatility assumption is 40.0% per annum. Each step in the simulation is five days and the number of trading days per year is 250, such that each time step is 5/250. The random standard normal is generated by inverse transformation of a random uniform variable (with a value from zero to 1.0).
a. $107.48 then $103.55
b. $103.29 then $98.75
c. $97.25 then $101.51
d. $102.78 then $104.14
Answers:
Note: for the questions below, we provide the following snippet from the standard normal CDF lookup table:

323.1. Assume a stock price following a geometric Brownian motion (GBM) process such that the natural log of the future stock price, S(t), is approximately normal:

The current stock price, S(0), is $48.00 with volatility of 36.0% per annum. The expected return (mu) is 18.0% per annum. Assuming this model, which is nearest to the probability that the stock price will end the year (T = 1.0) above $60.00? [Sidebar bonus question: Why is the answer different than N(d2) in BSM, or is it the same?]
a. 17.03%
b. 24.55%
c. 38.21%
d. 44.82%
323.2. Analyst Peter needs to price an American call option with one year to maturity. He has convenient access to only two option pricing models: a Black-Scholes Merton (BSM OPM), which he presumes is exact due to its analytical solution; and a binomial tree with twelve steps, which he presumes is inaccurate due to the low number of steps. He performs the following calculations:
- For the American option, the binomial model returns a price of $8.70 (which he realizes is inaccurate)
- He runs the binomial model again, on the same call option, except he assumes it is a European option (i.e., same option parameters but cannot be early exercised); this variant of the binomial returns a price of $8.25.
- He prices this European option, also, with his Black-Scholes (which he trusts is exact for the European option) and it gives a price of $8.12.
- Based on these findings, he estimates the value of the American option to be equal to $8.70 + ($8.12 - $8.25) = $8.57.
a. Antithetic variable technique
b. Control variate technique
c. Quasi-random sequences
d. None of the above, Peter's method is without merit
323.3. A Monte Carlo simulation (MCS) assumes that a non-dividend-paying stock follows the process given by the discrete-time version of geometric Brownian motion (gBm):

The initial stock price, S(0), is $100.00. The expected return (mu) is 15.0% per annum. The volatility assumption is 40.0% per annum. Each step in the simulation is five days and the number of trading days per year is 250, such that each time step is 5/250. The random standard normal is generated by inverse transformation of a random uniform variable (with a value from zero to 1.0).
- For the first week, the random uniform variable is 0.8980
- For the second week, the random uniform variable is 0.2429
a. $107.48 then $103.55
b. $103.29 then $98.75
c. $97.25 then $101.51
d. $102.78 then $104.14
Answers:
