Questions:
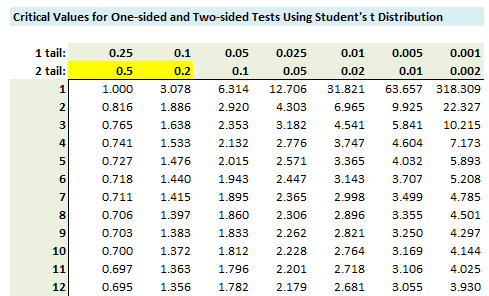
317.1. For a sample of ten (n = 10) market-neutral hedge funds, analyst Peter finds their sample average monthly excess return to be +0.890% with a sample standard deviation of 1.00%. He wants to conduct a one-tailed test of significance, specifically: his null hypothesis is that the true excess return is equal to, or less than, zero. Here is a snippet of the student's t lookup table:

Which is nearest to his p-value? (bonus: use the p-value in a sentence)
a. 0.01%
b. 0.50%
c. 1.00%
d. 2.00%
317.2. Let X and Y represent the rates of return (in percent) on two stocks. Their distributions are approximately normal: X ~ N(6, 3) and Y ~ N(10, 8) assuming conventional notation of N(mean, variance). The variables are positively correlated with a correlation coefficient of 0.20. Each of the following is true except which is false?
a. (X+Y) ~ N(16, 13)
b. (X-Y) ~ N(-4, 13)
c. 5X ~ N(30, 75)
d. (4X + 5Y) ~ N(74, 287)
317.3. The chart below graphs a mixture distribution, X, of two normal components: N(0, 2) which receives a weight of 30% and N(4,1) which receives the remainder weight of 70%:

Which is nearest to probability that the mixture distribution outcome is less than zero; i.e., Prob[X < 0]?
a. 15.0%
b. 30.0%
c. 47.5%
d. 70.0%
Answers:
317.1. For a sample of ten (n = 10) market-neutral hedge funds, analyst Peter finds their sample average monthly excess return to be +0.890% with a sample standard deviation of 1.00%. He wants to conduct a one-tailed test of significance, specifically: his null hypothesis is that the true excess return is equal to, or less than, zero. Here is a snippet of the student's t lookup table:

Which is nearest to his p-value? (bonus: use the p-value in a sentence)
a. 0.01%
b. 0.50%
c. 1.00%
d. 2.00%
317.2. Let X and Y represent the rates of return (in percent) on two stocks. Their distributions are approximately normal: X ~ N(6, 3) and Y ~ N(10, 8) assuming conventional notation of N(mean, variance). The variables are positively correlated with a correlation coefficient of 0.20. Each of the following is true except which is false?
a. (X+Y) ~ N(16, 13)
b. (X-Y) ~ N(-4, 13)
c. 5X ~ N(30, 75)
d. (4X + 5Y) ~ N(74, 287)
317.3. The chart below graphs a mixture distribution, X, of two normal components: N(0, 2) which receives a weight of 30% and N(4,1) which receives the remainder weight of 70%:

Which is nearest to probability that the mixture distribution outcome is less than zero; i.e., Prob[X < 0]?
a. 15.0%
b. 30.0%
c. 47.5%
d. 70.0%
Answers:
