Questions:
405.1. Let the market timing score be equal to the proportion of correct forecasts of bull markets, P(1), plus the proportion of correct forecasts of bear markets, P(2), minus one; i.e., per score = P(1) + P(2) - 1.0. During the fourteen calendar years from 2000 to 2013, a market economist predicted a bear market for each of the first seven years, until 2006, then switched his view and predicted bull markets for the subsequent seven years. Below are displayed the actual returns for the market (using the S&P 500 as proxy) over the same fourteen years:
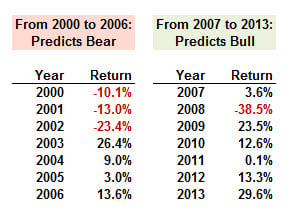
Which is nearest to the economist's market timing score?
a. Zero
b. 0.28
c. 0.35
d. 0.49
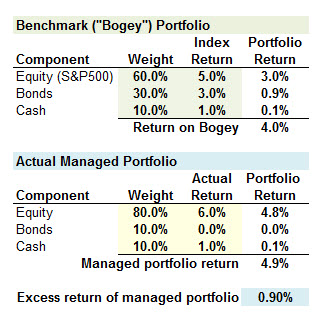
405.2. A portfolio manager is evaluated by a style analysis that compares her actively managed portfolio to the benchmark portfolio; aka, bogey. The benchmark portfolio invests in three components: 60.0% in the S&P 500 (the equity index), 30.0% in a Lehman Bond Index (the bond index), and 10.0% in a money market fund (the cash index). A portfolio passively invested in this bogey portfolio would have returned +4.0% over the period. The manager's actual portfolio components included 80.0% in equities, 10.0% in bonds, and 10.0% in cash. The manager's actual portfolio overperformed the bogey by 90 basis points (i.e., 4.9% actual portfolio return compared to a 4.0% bogey portfolio return):
If the excess return of +0.9% is decomposed into two components, asset allocation and security selection, what is the contribution to the excess return from asset allocation?
a. -0.20%
b. Zero
c. +0.40%
d. +0.75%
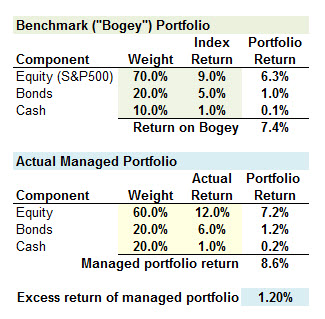
405.3. A portfolio manager is evaluated by a style analysis that compares her actively managed portfolio to the benchmark portfolio; aka, bogey. The benchmark portfolio invests in three components: 70.0% in the S&P 500 (the equity index), 20.0% in a Lehman Bond Index (the bond index), and 10.0% in a money market fund (the cash index). A portfolio passively invested in this bogey portfolio would have returned +7.4% over the period. The manager's actual portfolio components included 60.0% in equities, 20.0% in bonds, and 20.0% in cash. The manager's actual portfolio overperformed the bogey by 120 basis points (i.e., 8.6% actual portfolio return compared to a 7.4% bogey portfolio return):
If the excess return of +0.9% is decomposed into two components, asset allocation and security selection, what is the contribution to the excess return from security selection?
a. -0.80%
b. 0.80%
c. 1.30%
d. 2.00%
Answers here:
405.1. Let the market timing score be equal to the proportion of correct forecasts of bull markets, P(1), plus the proportion of correct forecasts of bear markets, P(2), minus one; i.e., per score = P(1) + P(2) - 1.0. During the fourteen calendar years from 2000 to 2013, a market economist predicted a bear market for each of the first seven years, until 2006, then switched his view and predicted bull markets for the subsequent seven years. Below are displayed the actual returns for the market (using the S&P 500 as proxy) over the same fourteen years:
Which is nearest to the economist's market timing score?
a. Zero
b. 0.28
c. 0.35
d. 0.49
405.2. A portfolio manager is evaluated by a style analysis that compares her actively managed portfolio to the benchmark portfolio; aka, bogey. The benchmark portfolio invests in three components: 60.0% in the S&P 500 (the equity index), 30.0% in a Lehman Bond Index (the bond index), and 10.0% in a money market fund (the cash index). A portfolio passively invested in this bogey portfolio would have returned +4.0% over the period. The manager's actual portfolio components included 80.0% in equities, 10.0% in bonds, and 10.0% in cash. The manager's actual portfolio overperformed the bogey by 90 basis points (i.e., 4.9% actual portfolio return compared to a 4.0% bogey portfolio return):
If the excess return of +0.9% is decomposed into two components, asset allocation and security selection, what is the contribution to the excess return from asset allocation?
a. -0.20%
b. Zero
c. +0.40%
d. +0.75%
405.3. A portfolio manager is evaluated by a style analysis that compares her actively managed portfolio to the benchmark portfolio; aka, bogey. The benchmark portfolio invests in three components: 70.0% in the S&P 500 (the equity index), 20.0% in a Lehman Bond Index (the bond index), and 10.0% in a money market fund (the cash index). A portfolio passively invested in this bogey portfolio would have returned +7.4% over the period. The manager's actual portfolio components included 60.0% in equities, 20.0% in bonds, and 20.0% in cash. The manager's actual portfolio overperformed the bogey by 120 basis points (i.e., 8.6% actual portfolio return compared to a 7.4% bogey portfolio return):
If the excess return of +0.9% is decomposed into two components, asset allocation and security selection, what is the contribution to the excess return from security selection?
a. -0.80%
b. 0.80%
c. 1.30%
d. 2.00%
Answers here:
Last edited by a moderator:
") ... thanks!
... thanks!