Learning objectives: Distinguish between independent and mutually exclusive events. Define joint probability, describe a probability matrix, and calculate joint probabilities using probability matrices. Define and calculate a conditional probability, and distinguish between conditional and unconditional probabilities.
Questions:
709.1. The following probability matrix gives the joint probabilities (the inner square represents joint probabilities) of variable X which can assume one of three values {1, 2, 3} and variable Y which can assume one of three values {1, 3, 5}:

Are the two variables independent?
a. No, because 20.0% * 35.0% does not equal 6.0%
b. No, because the upper diagonal is not a mirror of the lower diagonal
c. Yes, because the sum of joint probabilities is 100% which is equal to the sum of each variable's unconditional probabilities
d. It cannot be determined with this information
709.2. The following joint probability matrix captures the relationship between Inflation (which can be either Down, Steady or Up) and the Market (which can be either Bear, Range-bound, or Bull):

About this joint probability matrix, each of the following statements is correct EXCEPT which is false?
a. The unconditional probability of a Bear Market is 19.0%
b. The probability of a Bull Market conditional on Up Inflation is about 58.8%
c. The probability of a Down Inflation conditional on a Bear Market is about 21.4%
d. The joint probability of Up Inflation and Range-bound Market is 8.0%
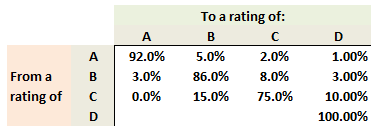
709.3. Below is a simplified one-year ratings transition matrix (aka, ratings migration matrix; please note this is NOT a joint probability table). Given a bond's rating now, the matrix gives the probability associated with the bond having a given rating at the end of the year. The rating of 'D' represents default.

What is the probability that a B-rated bond defaults over the next two (2) years; aka, two-year cumulative default probability? (this question is inspired by Miller's EOC Question 2.9). (Source: Michael Miller, Mathematics and Statistics for Financial Risk Management, 2nd Edition (Hoboken, NJ: John Wiley & Sons, 2013)
a. 1.960%
b. 3.410%
c. 5.910%
d. 6.410%
Answers here:
Questions:
709.1. The following probability matrix gives the joint probabilities (the inner square represents joint probabilities) of variable X which can assume one of three values {1, 2, 3} and variable Y which can assume one of three values {1, 3, 5}:

Are the two variables independent?
a. No, because 20.0% * 35.0% does not equal 6.0%
b. No, because the upper diagonal is not a mirror of the lower diagonal
c. Yes, because the sum of joint probabilities is 100% which is equal to the sum of each variable's unconditional probabilities
d. It cannot be determined with this information
709.2. The following joint probability matrix captures the relationship between Inflation (which can be either Down, Steady or Up) and the Market (which can be either Bear, Range-bound, or Bull):

About this joint probability matrix, each of the following statements is correct EXCEPT which is false?
a. The unconditional probability of a Bear Market is 19.0%
b. The probability of a Bull Market conditional on Up Inflation is about 58.8%
c. The probability of a Down Inflation conditional on a Bear Market is about 21.4%
d. The joint probability of Up Inflation and Range-bound Market is 8.0%
709.3. Below is a simplified one-year ratings transition matrix (aka, ratings migration matrix; please note this is NOT a joint probability table). Given a bond's rating now, the matrix gives the probability associated with the bond having a given rating at the end of the year. The rating of 'D' represents default.

What is the probability that a B-rated bond defaults over the next two (2) years; aka, two-year cumulative default probability? (this question is inspired by Miller's EOC Question 2.9). (Source: Michael Miller, Mathematics and Statistics for Financial Risk Management, 2nd Edition (Hoboken, NJ: John Wiley & Sons, 2013)
a. 1.960%
b. 3.410%
c. 5.910%
d. 6.410%
Answers here:
Last edited by a moderator:
